30DayMapChallenge
A repository with a collection of personal contributions to the #30DayMapChallenge by tjukanovt
Themes and contributions day by day
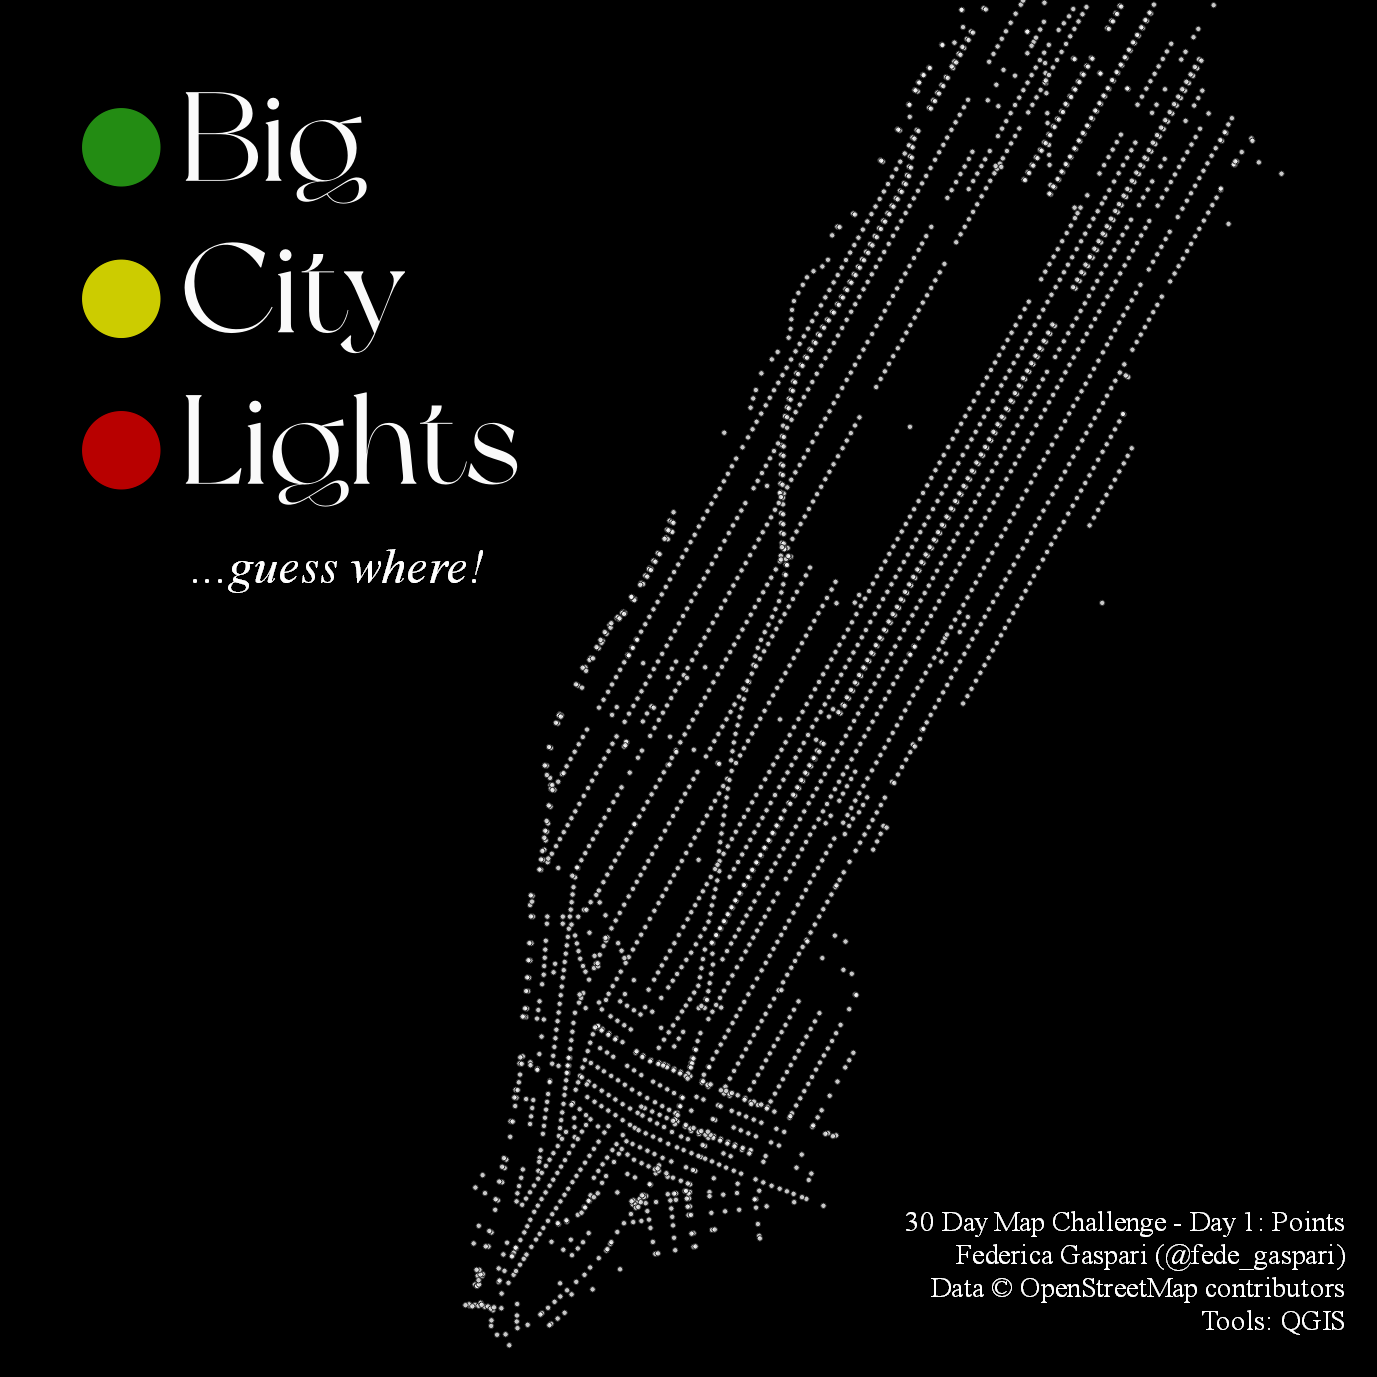
Day 1: Points
A map with points.
Traffic lights in Manhattan, New York (US). Data downloaded from OSM using OverpassTurbo and processed and visualized with QGIS.
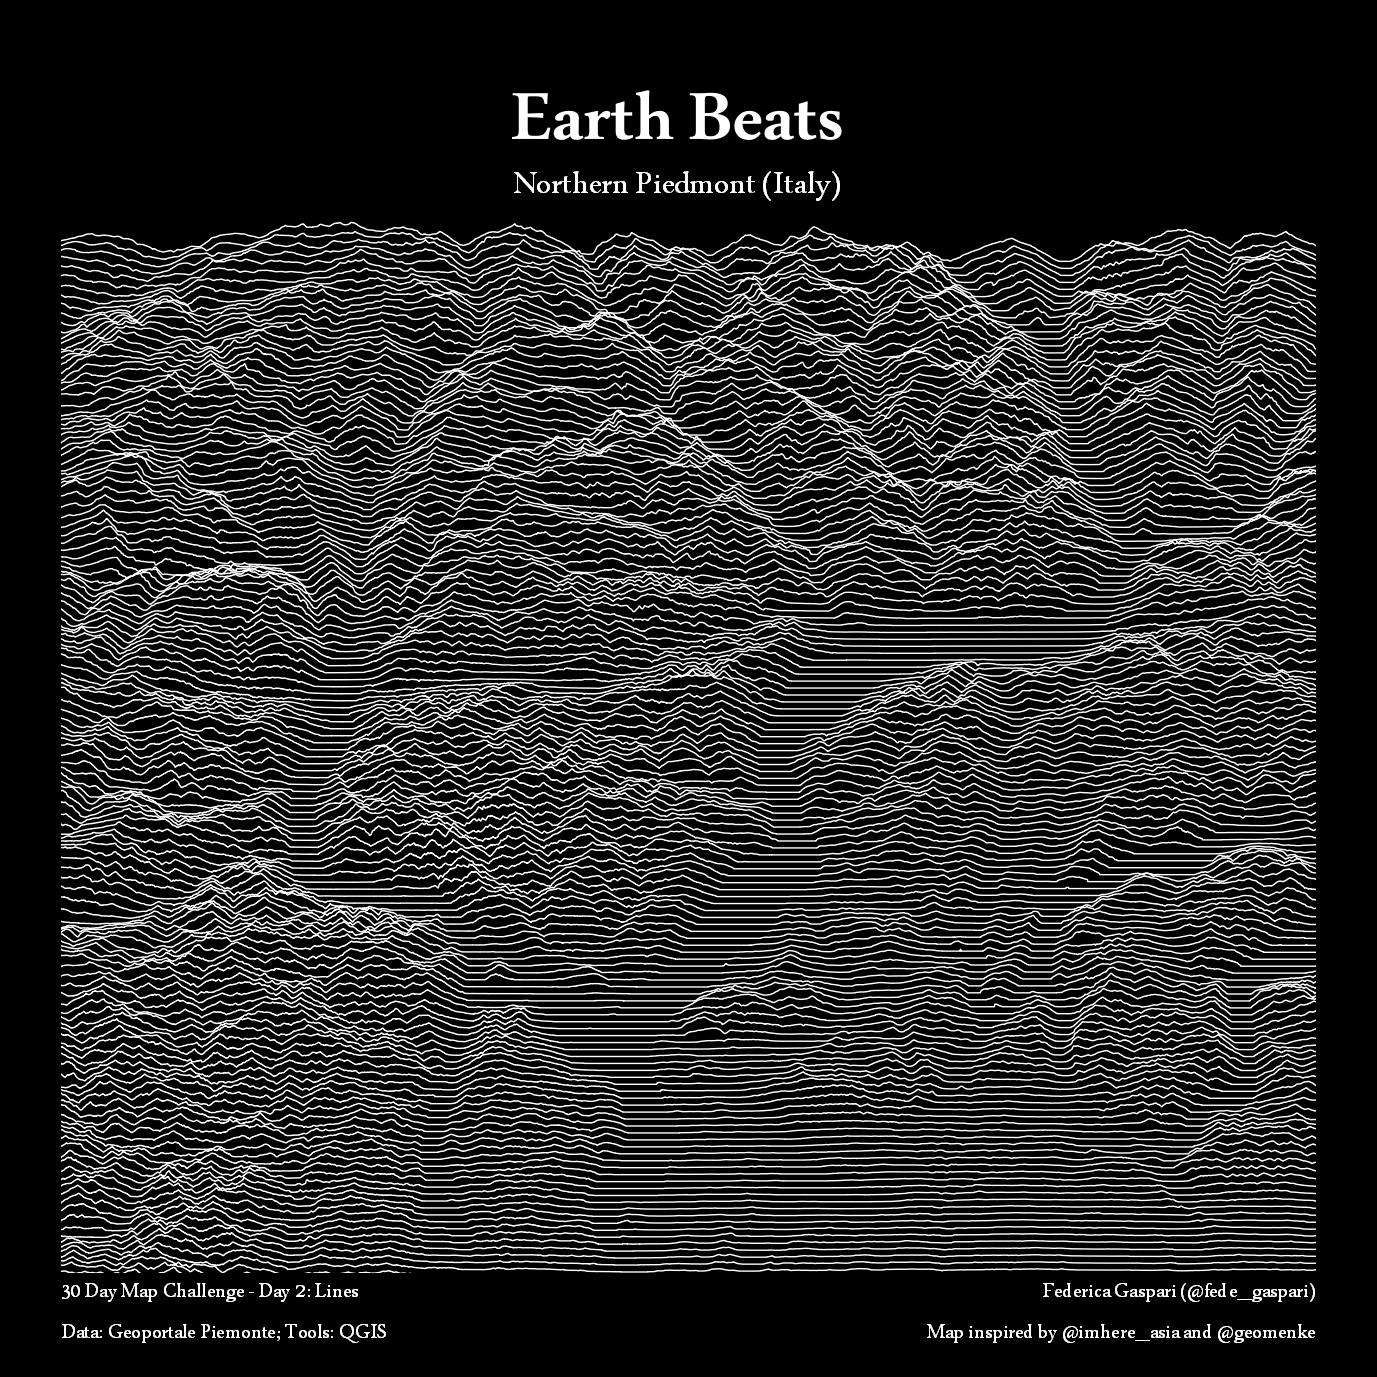
Day 2: Lines
A map with lines.
Terrain elevations of Northern Piedmont (Italy) visualized using Joy Division style based on @im_hereasia and @geomenke tutorial.
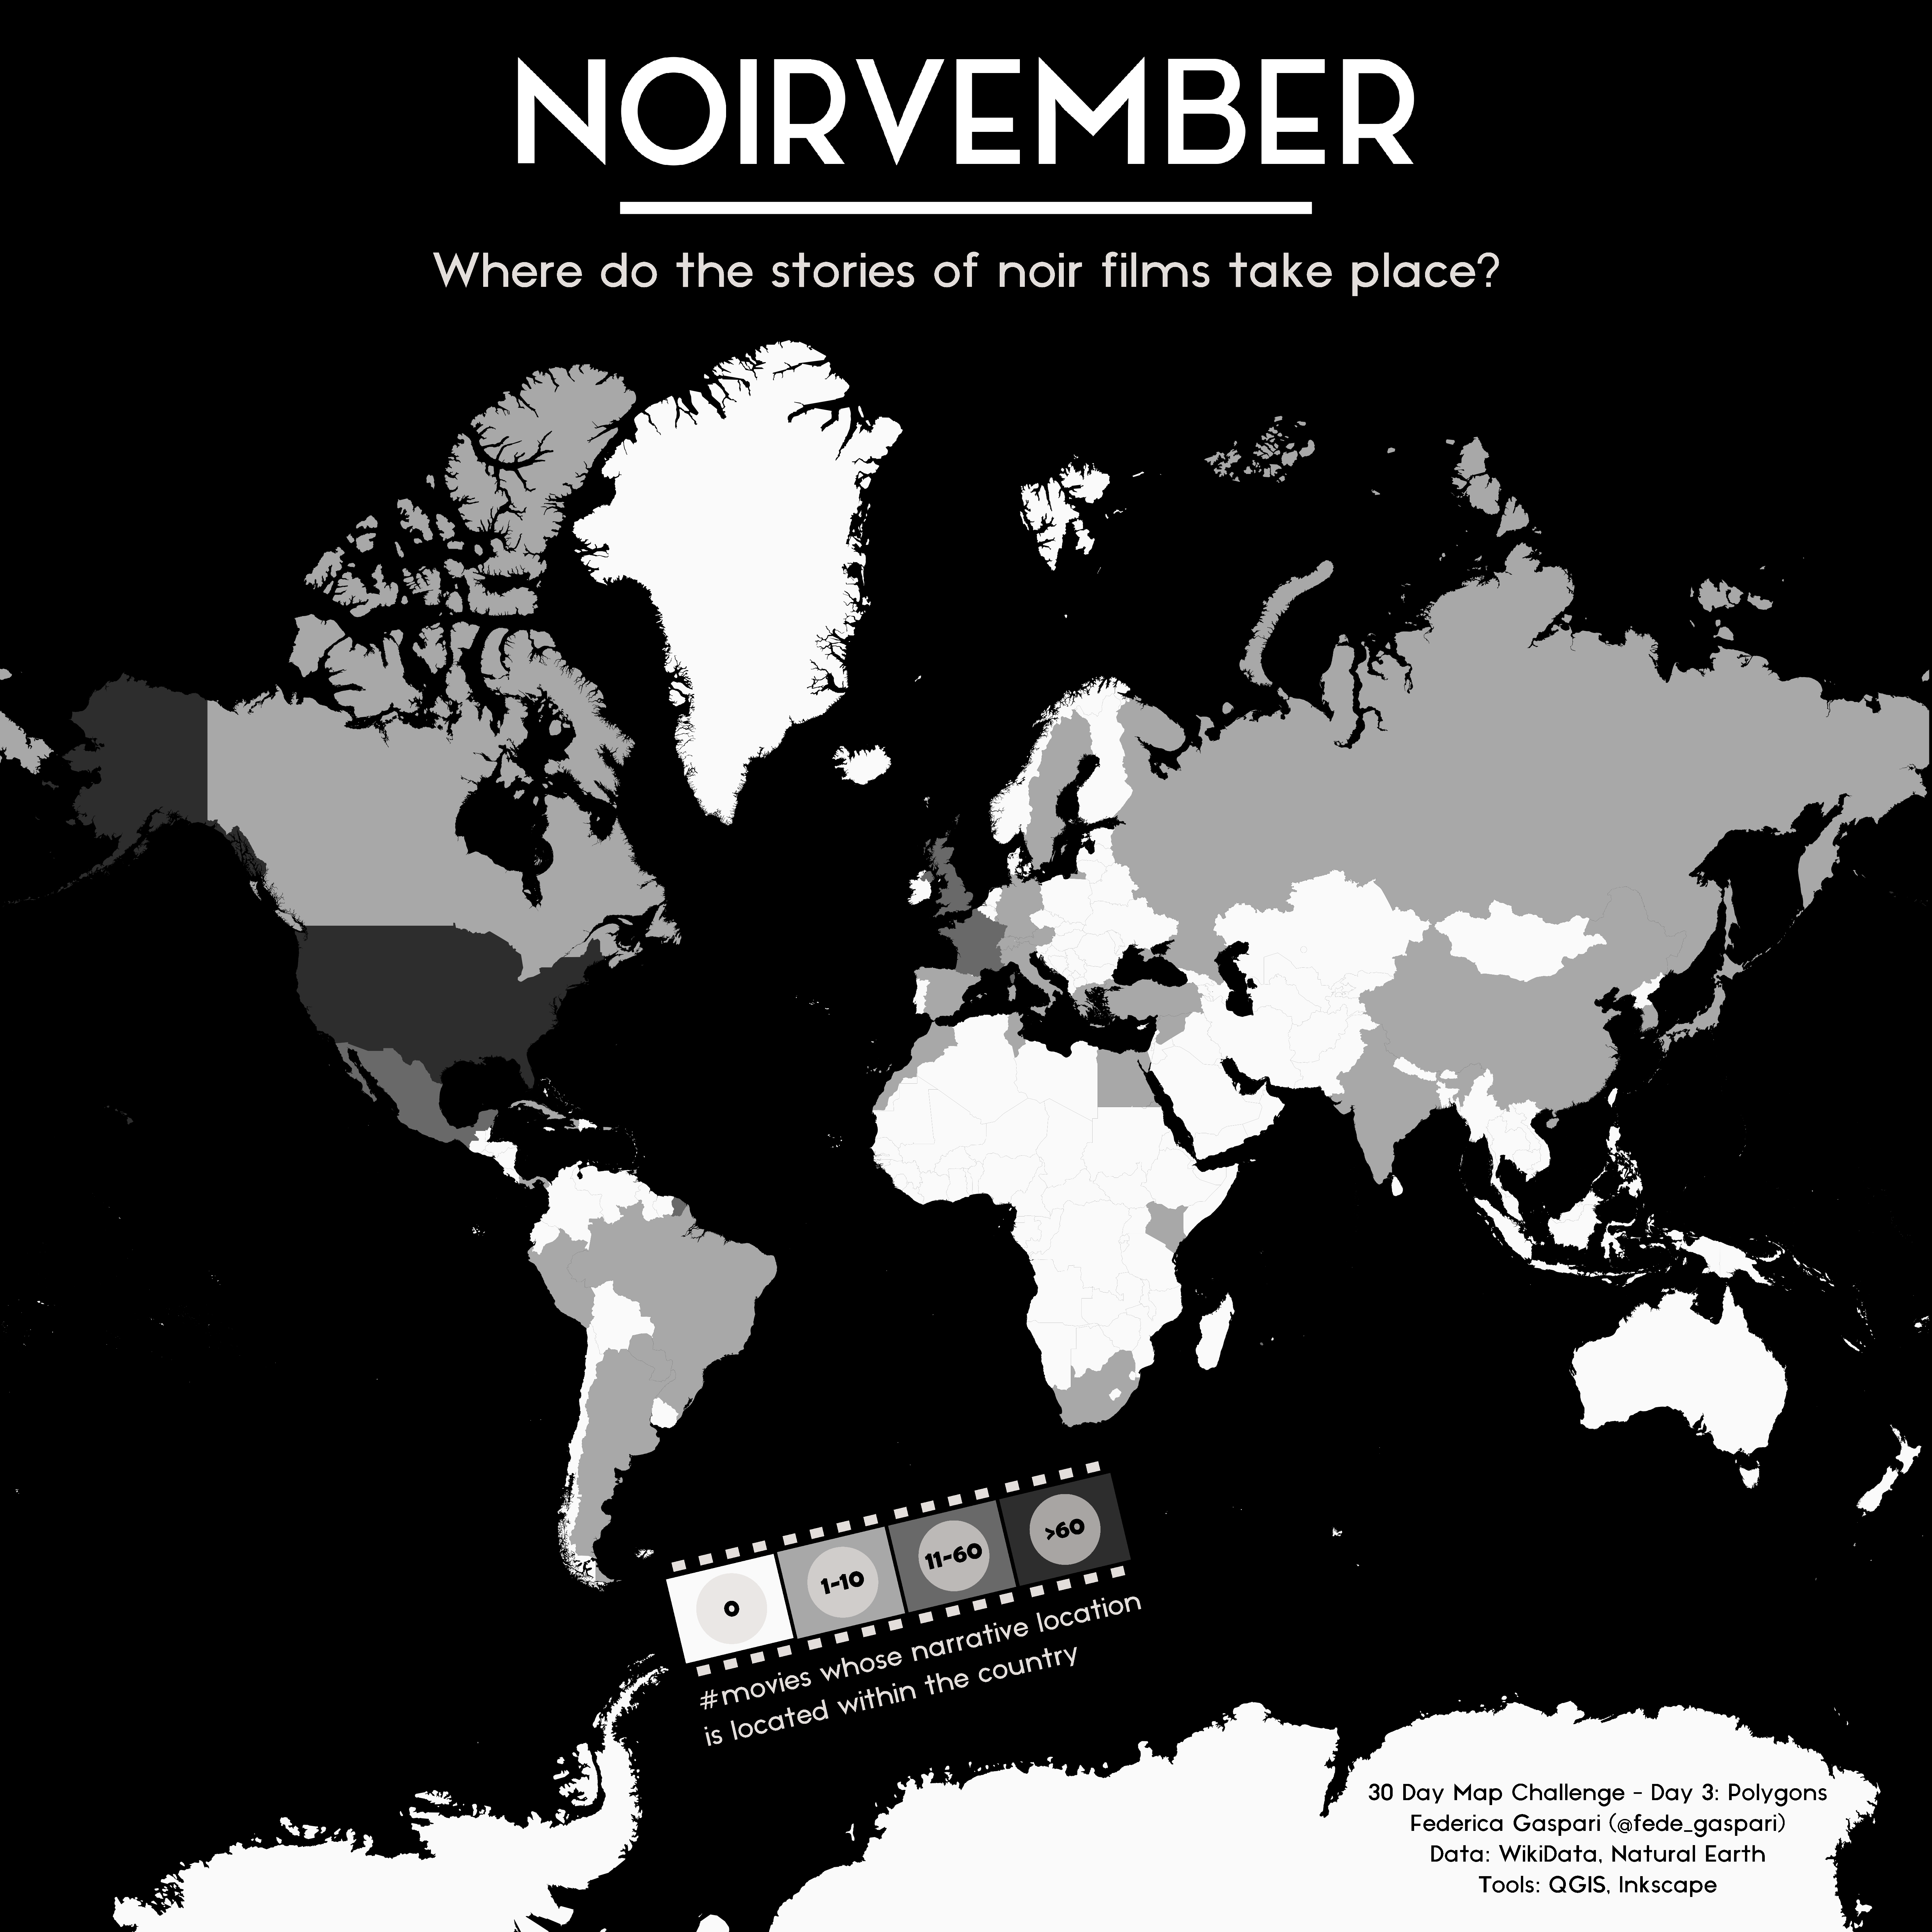
Day 3: Polygons
A map with polygons
Concentration of noir movies’ narrative locations based on WikiData information. WikiData query
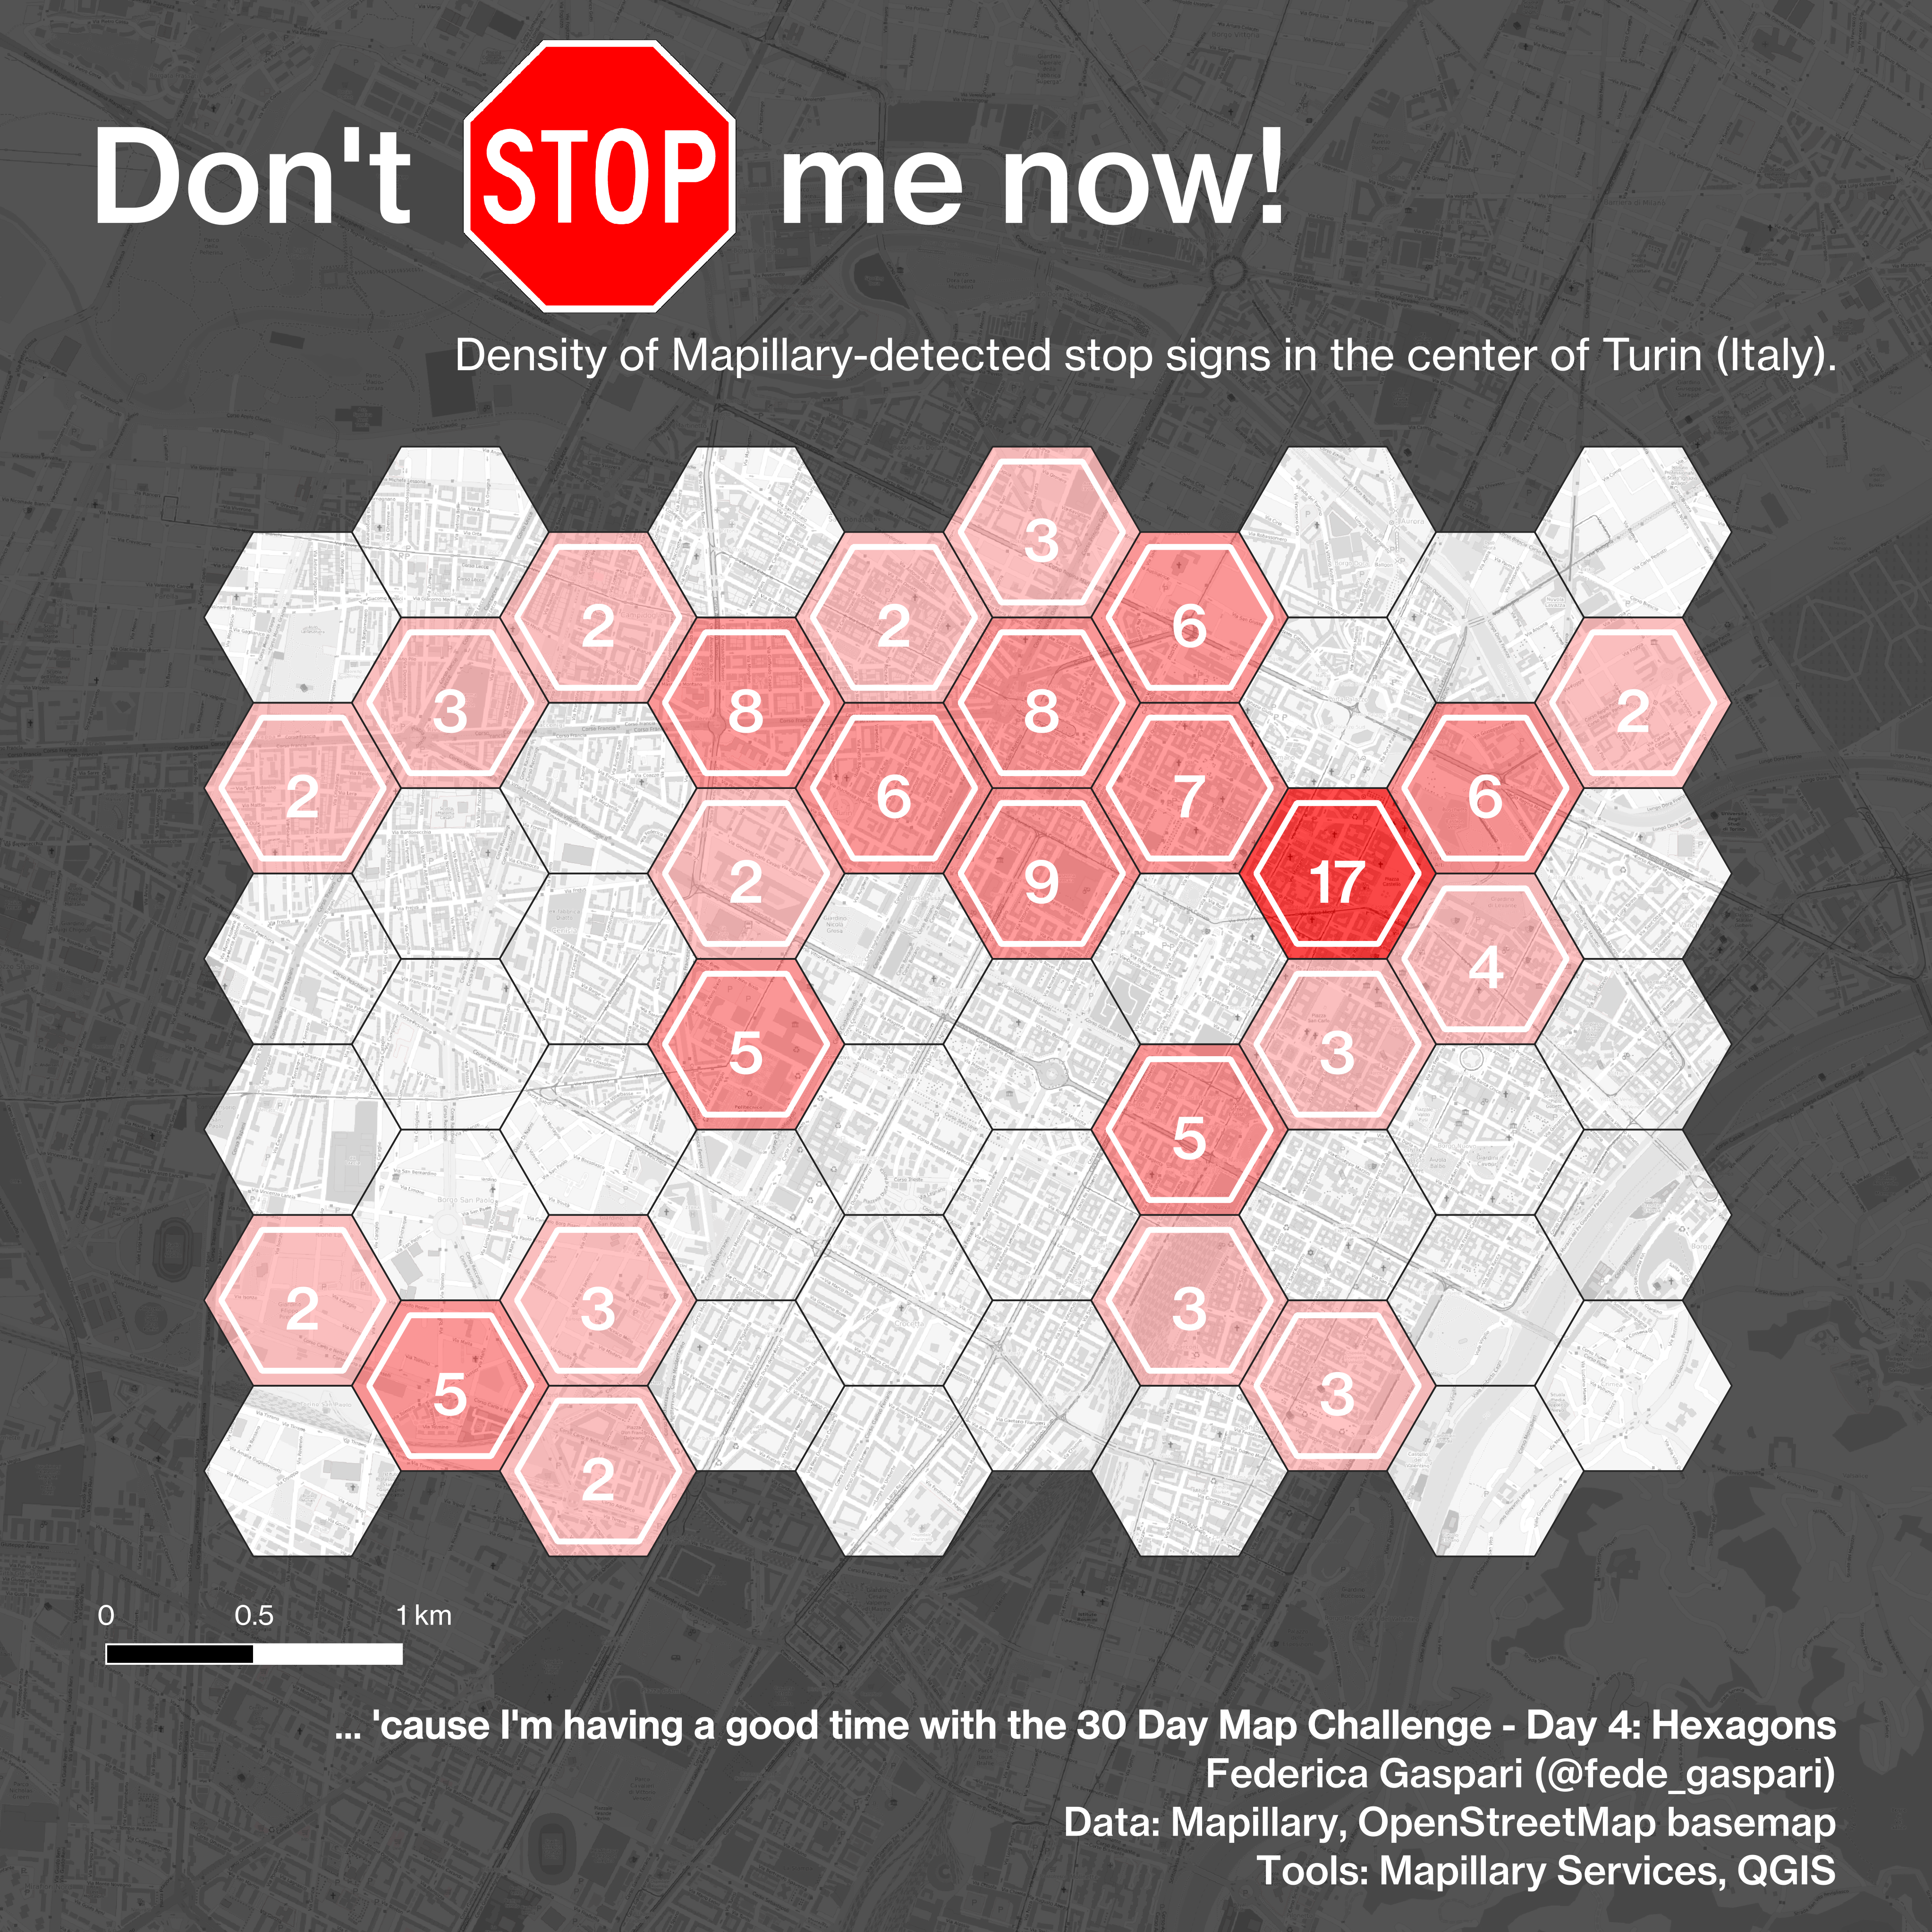
Day 4: Hexagons
A map with hexagons
Playing a bit with traffic signs data downloaded from Mapillary services and visualised using QGIS and Inkscape.
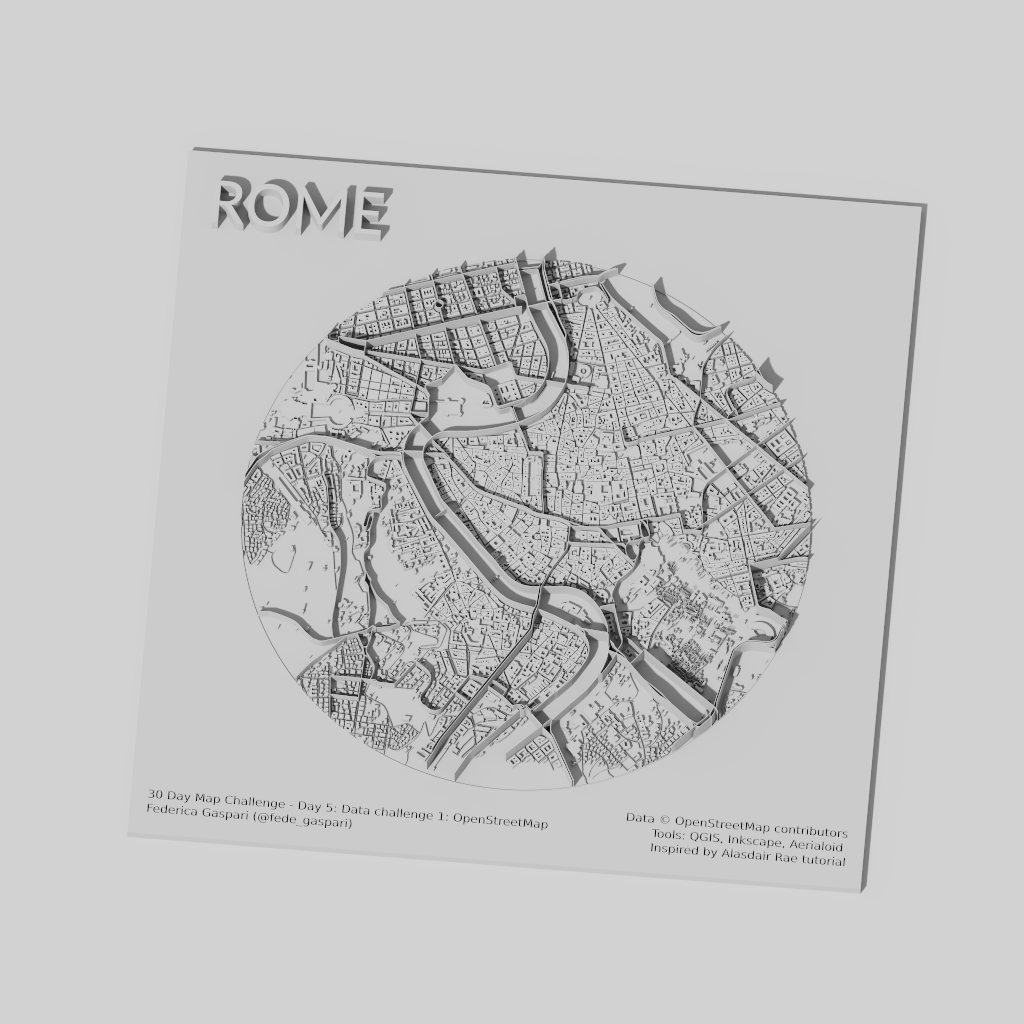
Day 5: Data challenge 1: OpenStreetMap
Use OSM to map something that is interesting to you.
3D (false)view of the streets and buildings of Rome with roads (primary, secondary, tertiary and residential ones) and buildings downloaded using QuickOSM. Composition made with QGIS with details added in Inkscape. Final 3D rendering made with Aerialoid and based on the great tutorial by Alasdair Rae (Arterial Cities Tutorial).
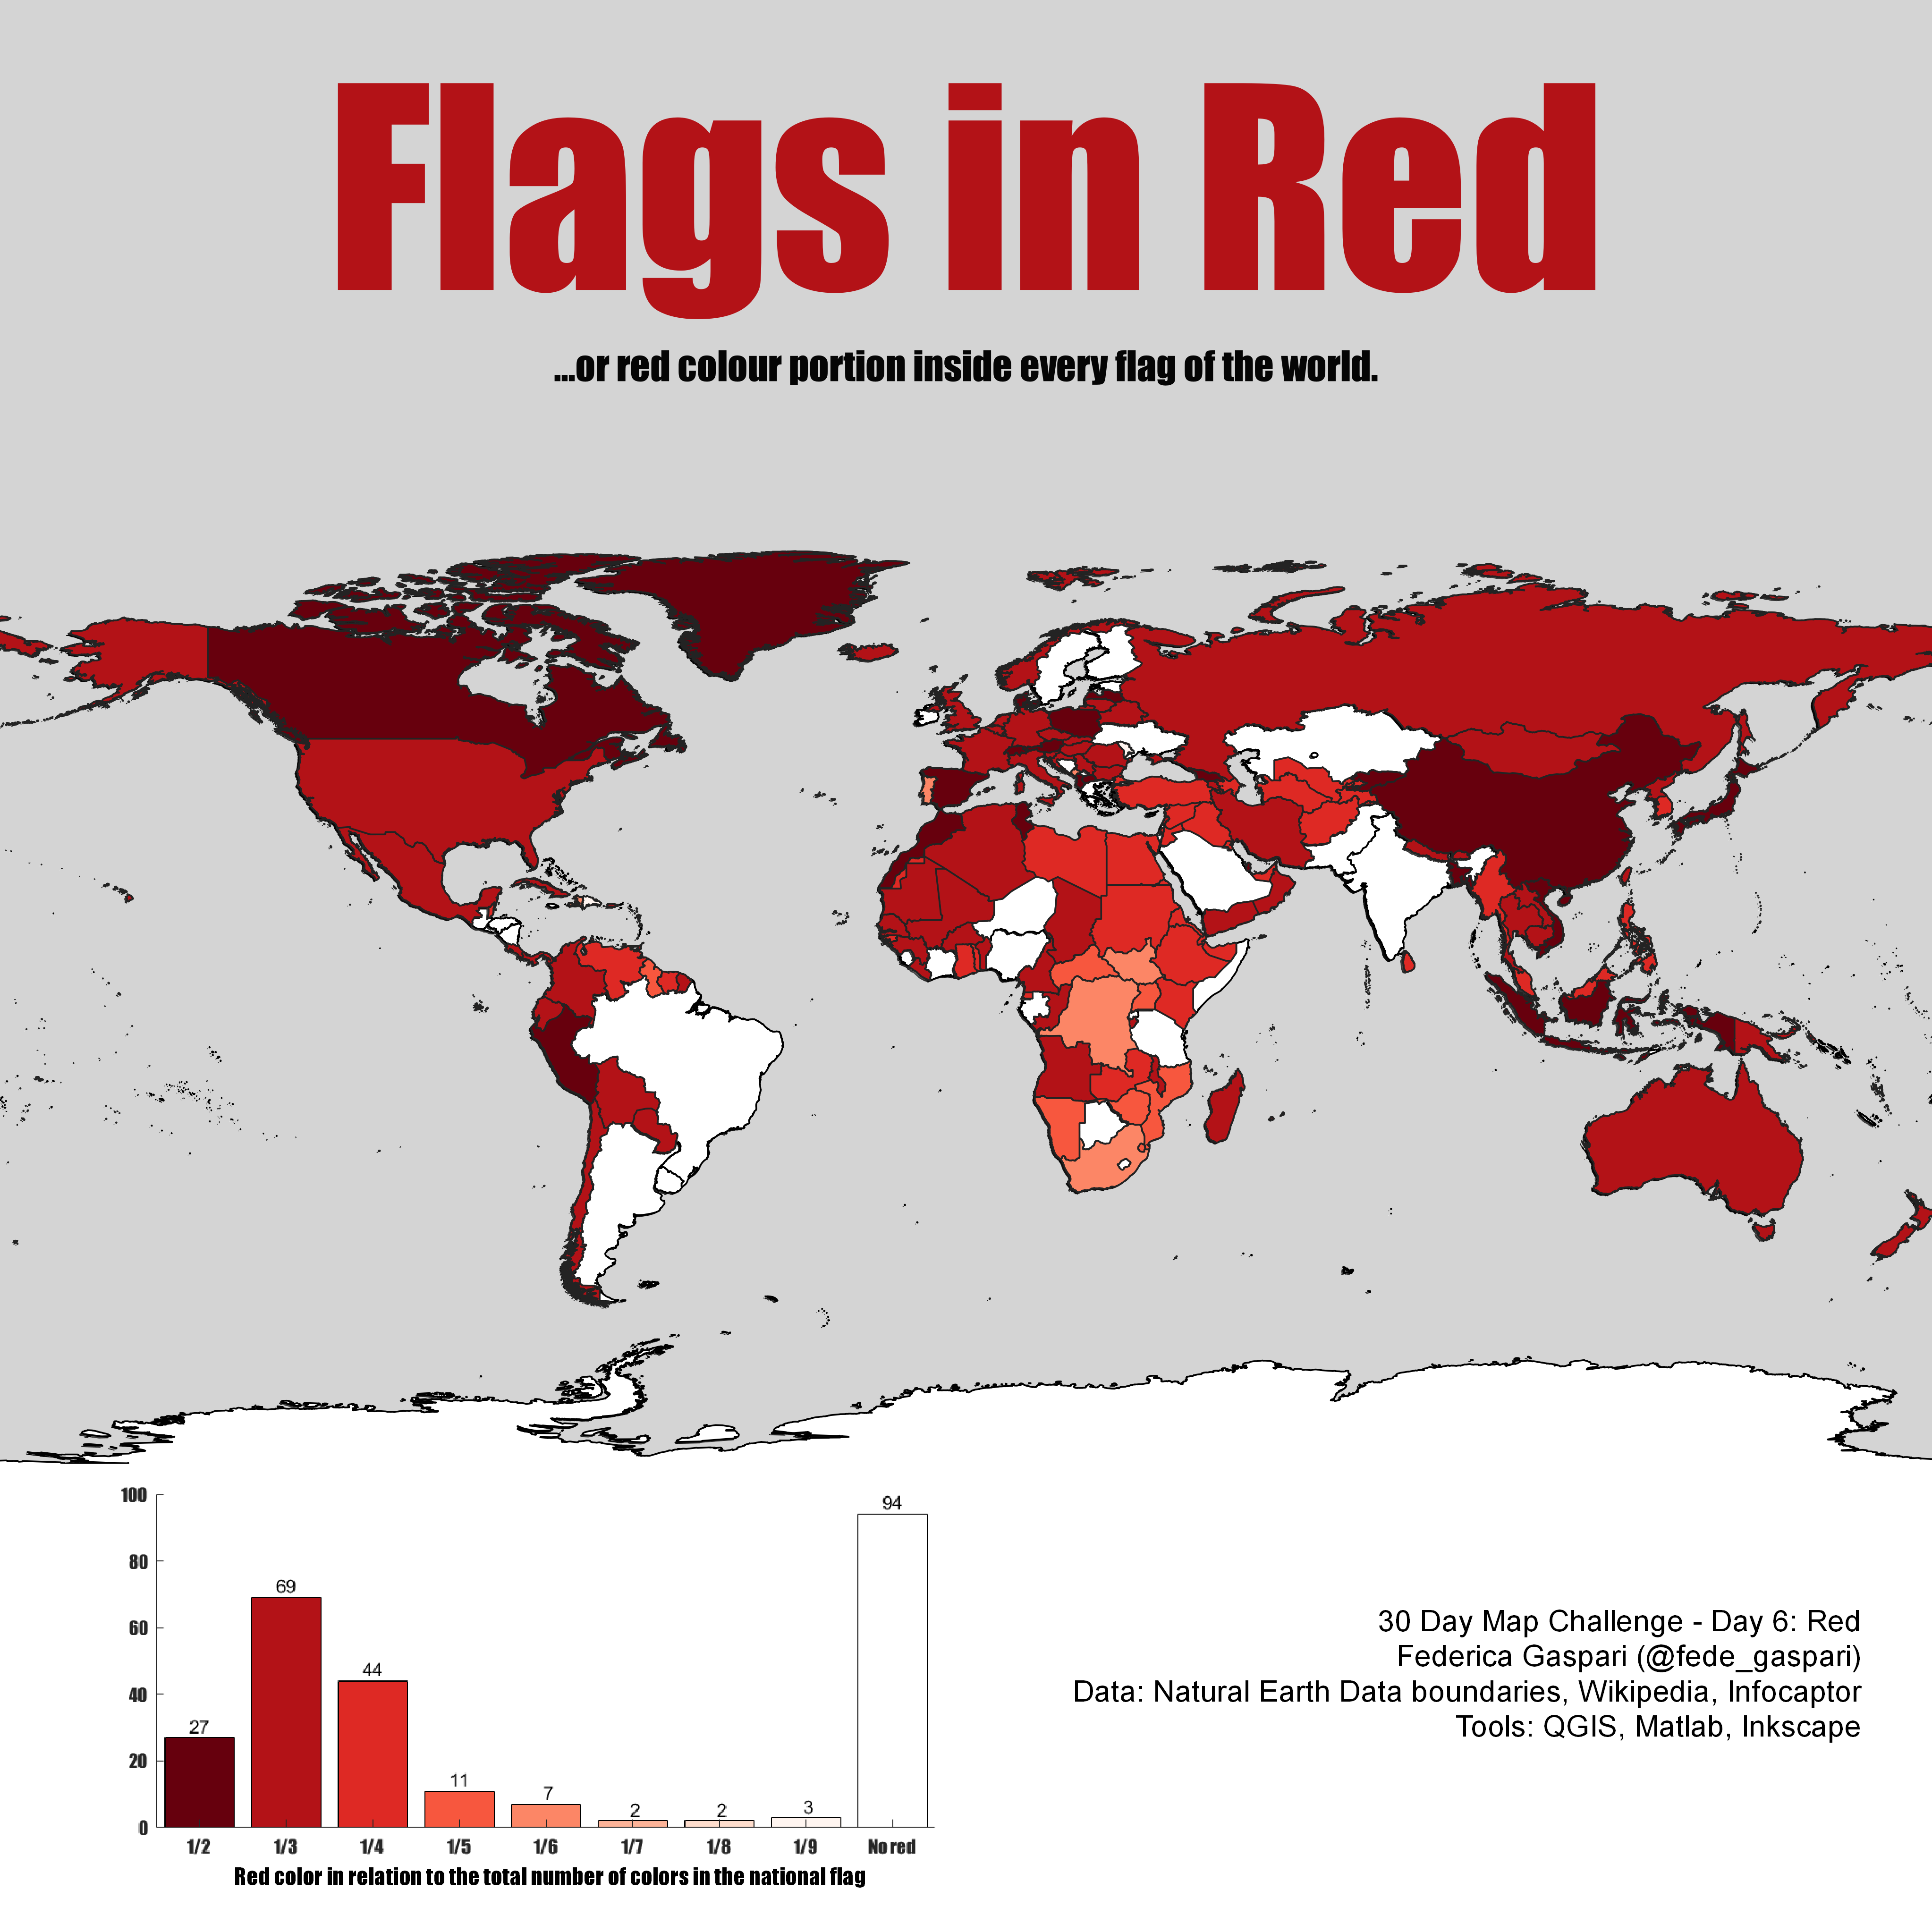
Day 6: Red
A map with the red colour or a map about something red.
Portion of red in national flags around the world. Data retrieved from Wikipedia and Infocaptor, processed with QGIS and MATLAB.
Day 7: Green
A map with the green colour or a map about something green.
NDVI calculated in different seasons for the municipality of Piacenza (Italy) using Sentinel 2 imagery and Geoportale Emilia Romagna data. Processed in QGIS with a little help of Inkscape for the visualisation. GIF made using GIMP.
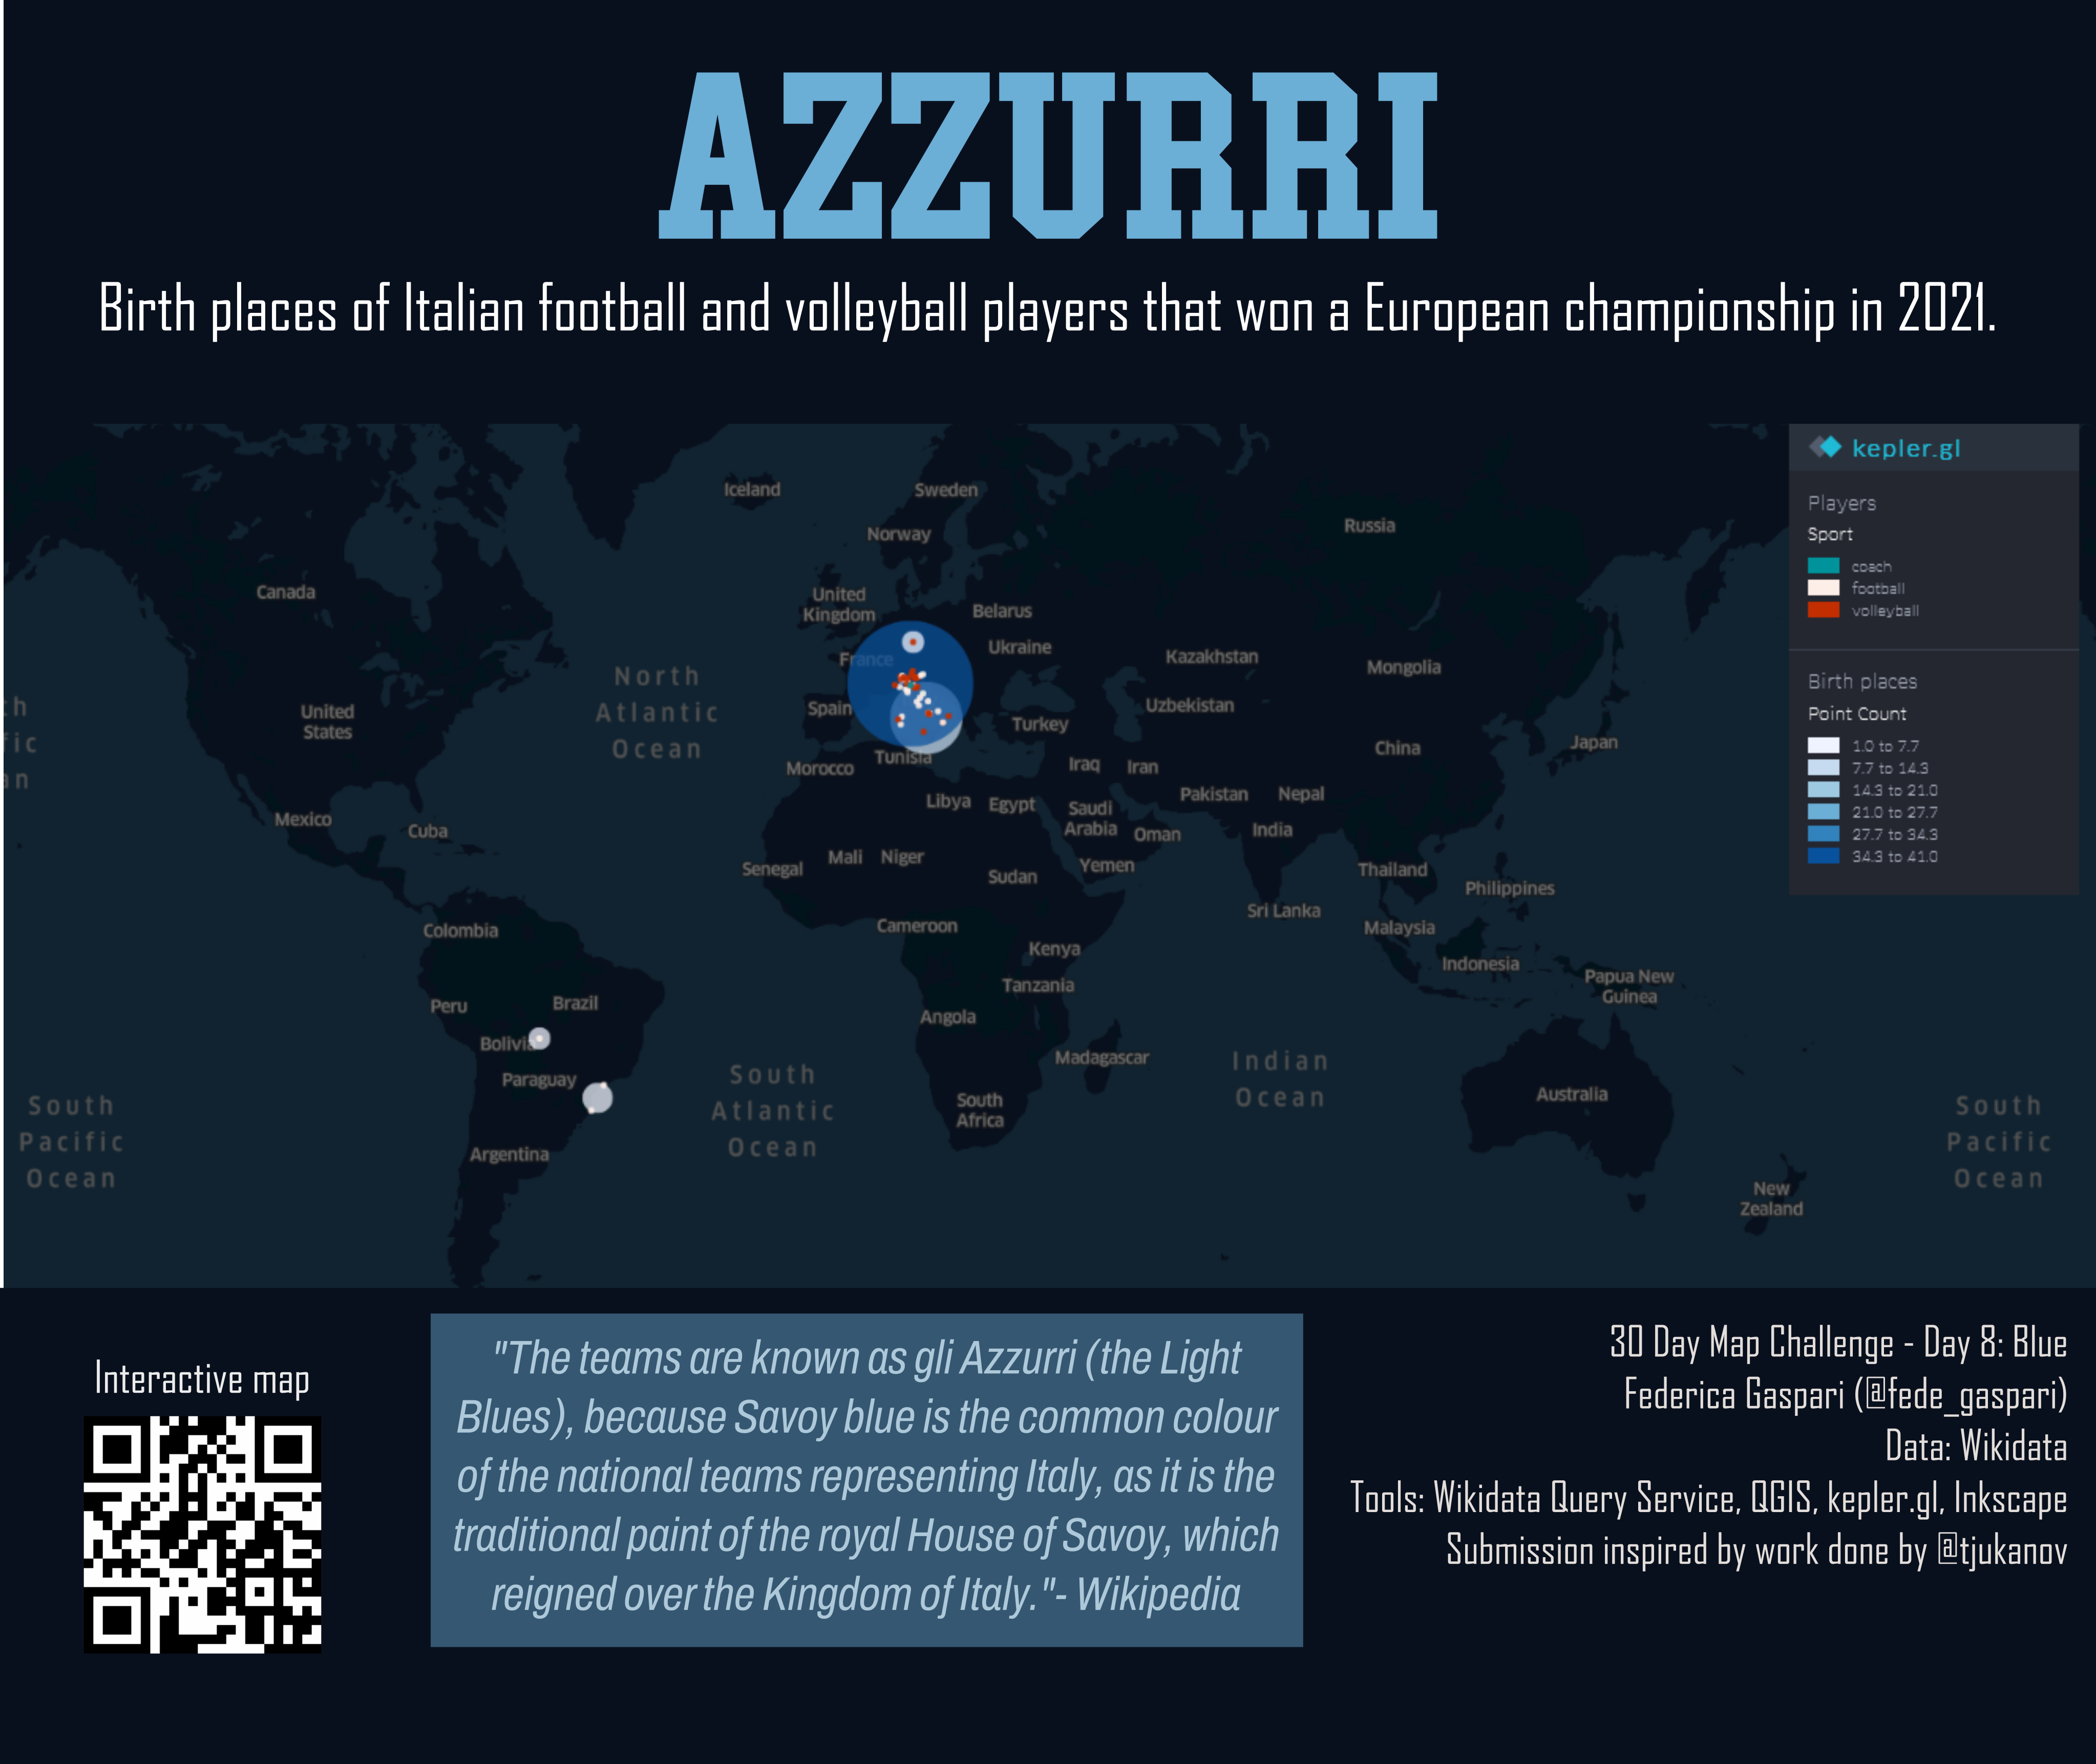
Day 8: Blue
A map with the blue colour or a map about something blue.
Map of the birth places of Italian volleyball and soccer players who won the 2021 European Championship. Data source: Wikidata (Soccer players - Volleyball women team - Volleyball men team. Tools: Wikidata Query Service, QGIS, kepler.gl, Inkscape. Inspired by work done by @tjukanov with soccer players at the 2021 European Championship.a
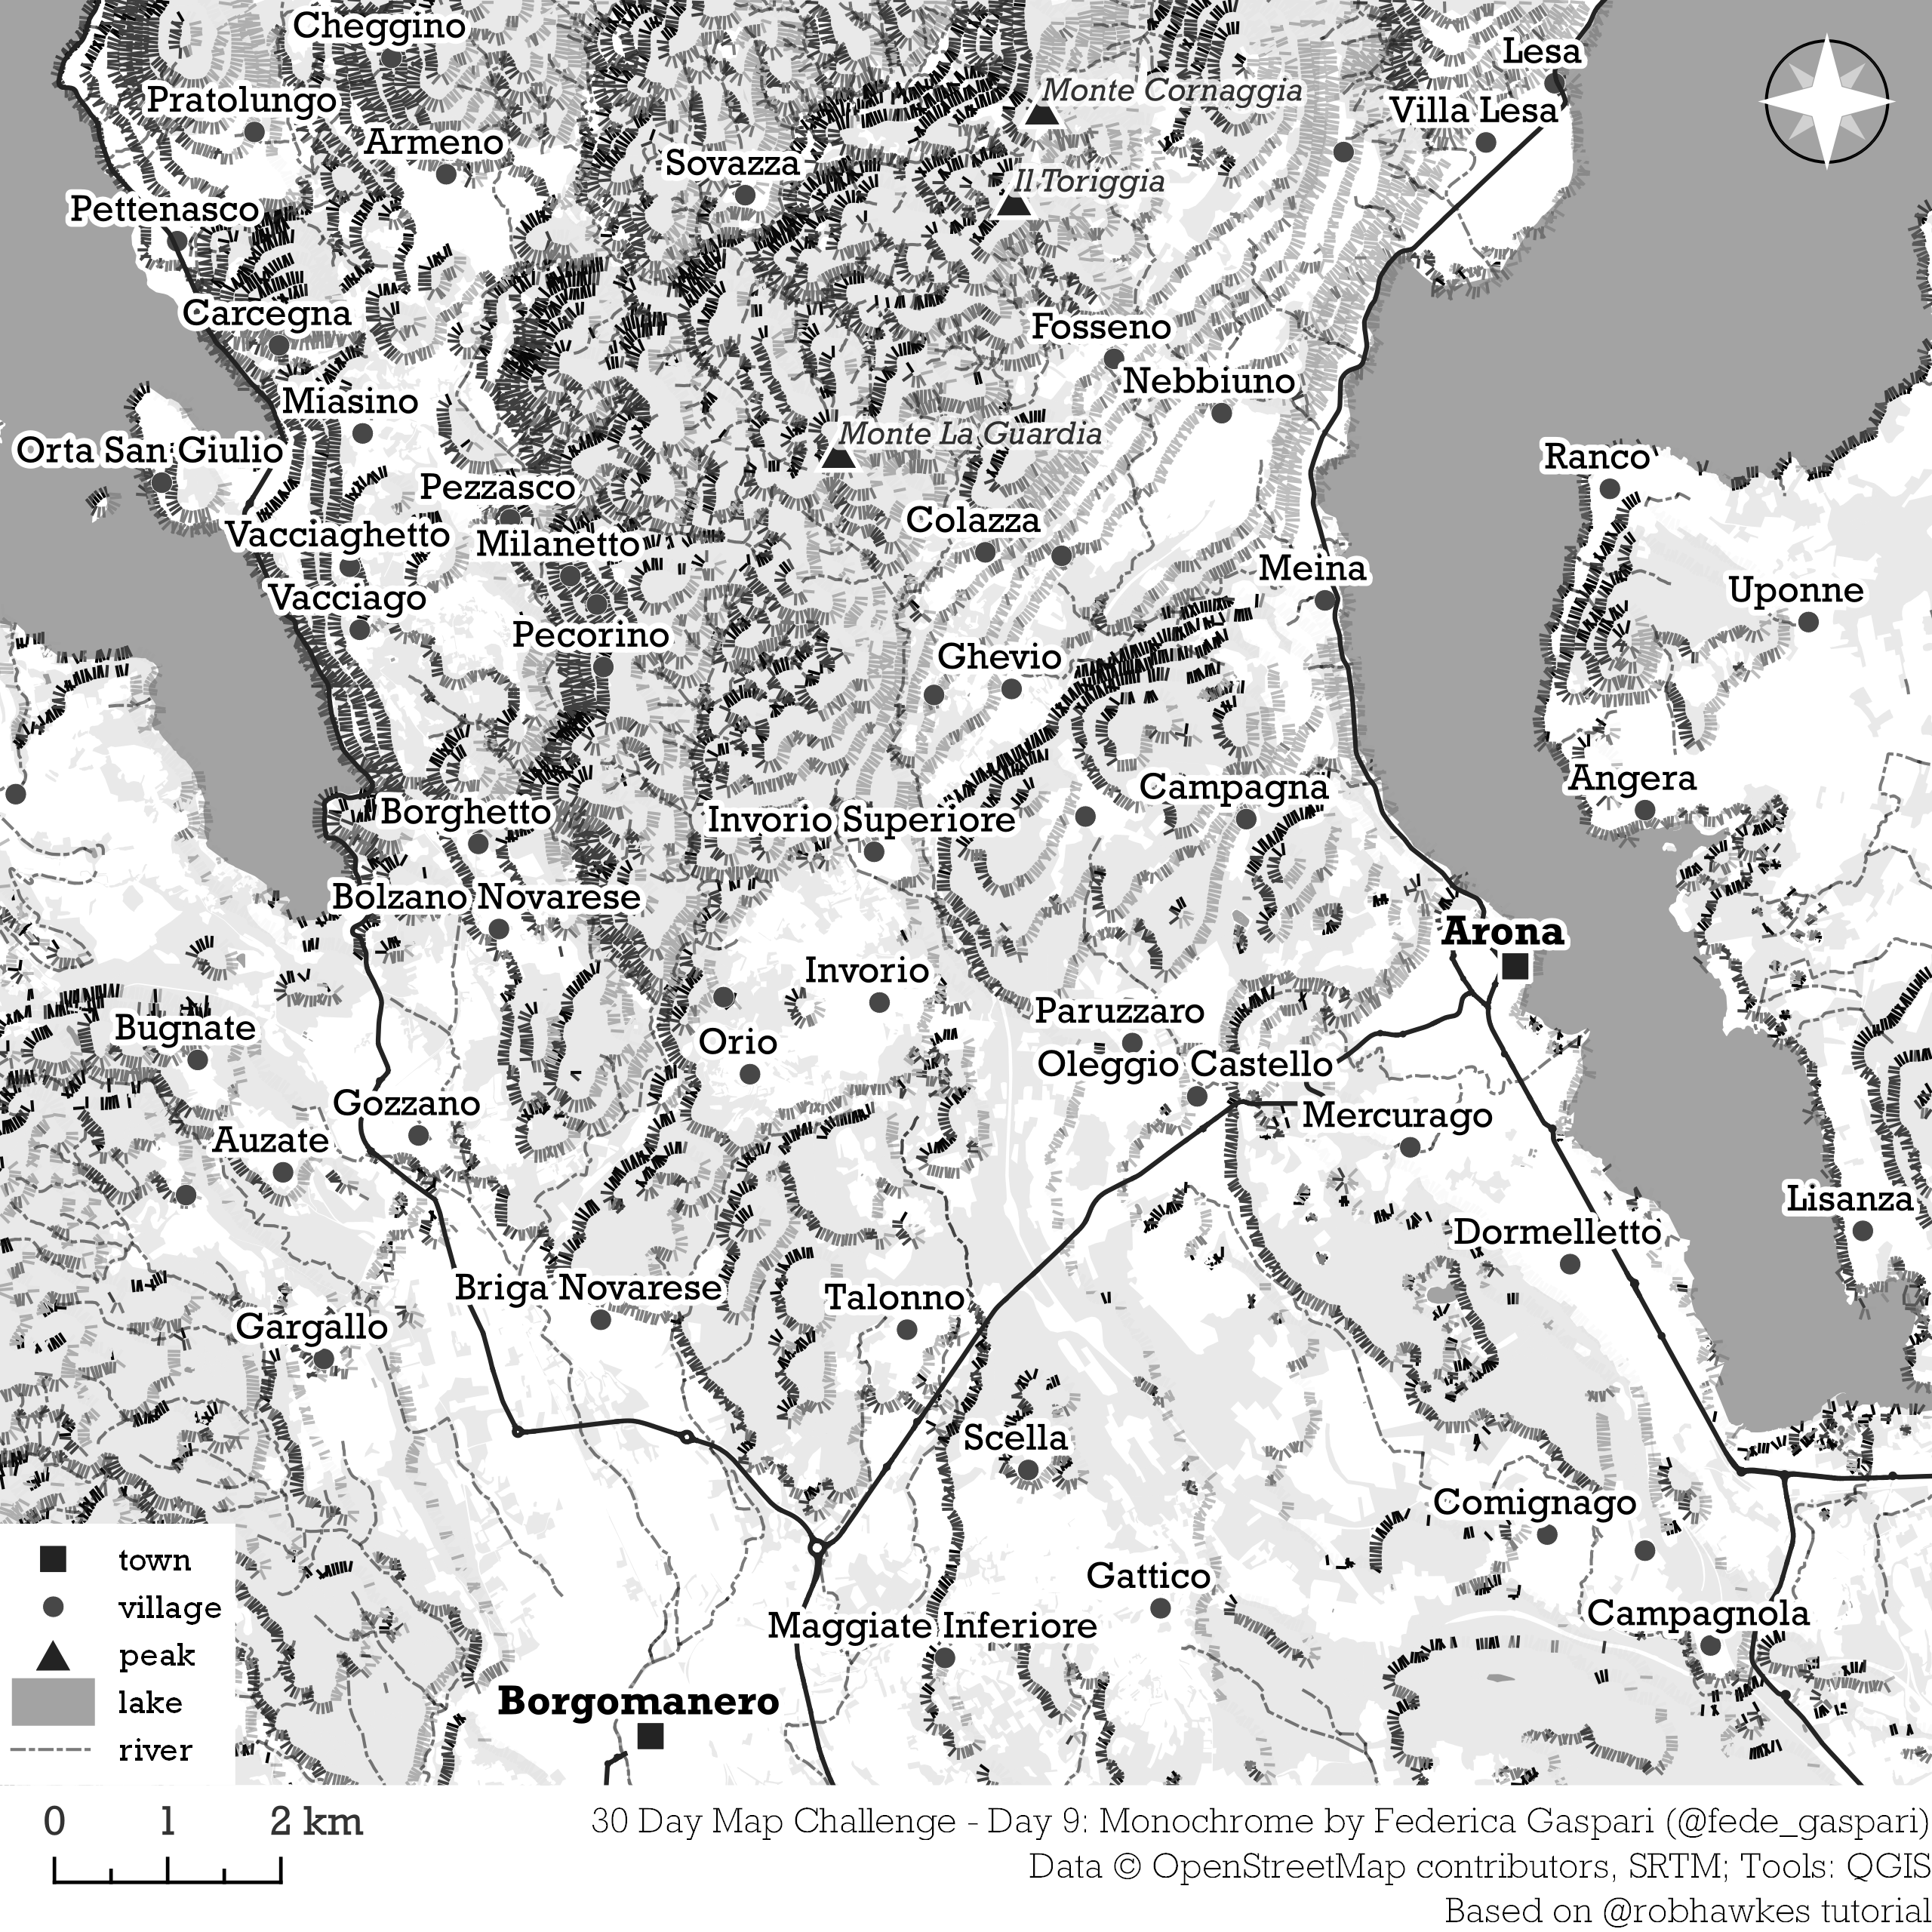
Day 9: Monochrome
A monochromic image is composed of one color (or values of one color). So for example black and white maps are valid here.
Monochrome map of my hometown area by Lake Maggiore and Orta based on the hachure style by Robin Hawkes. Data from OpenStreetMap processed and visualized on QGIS environment.
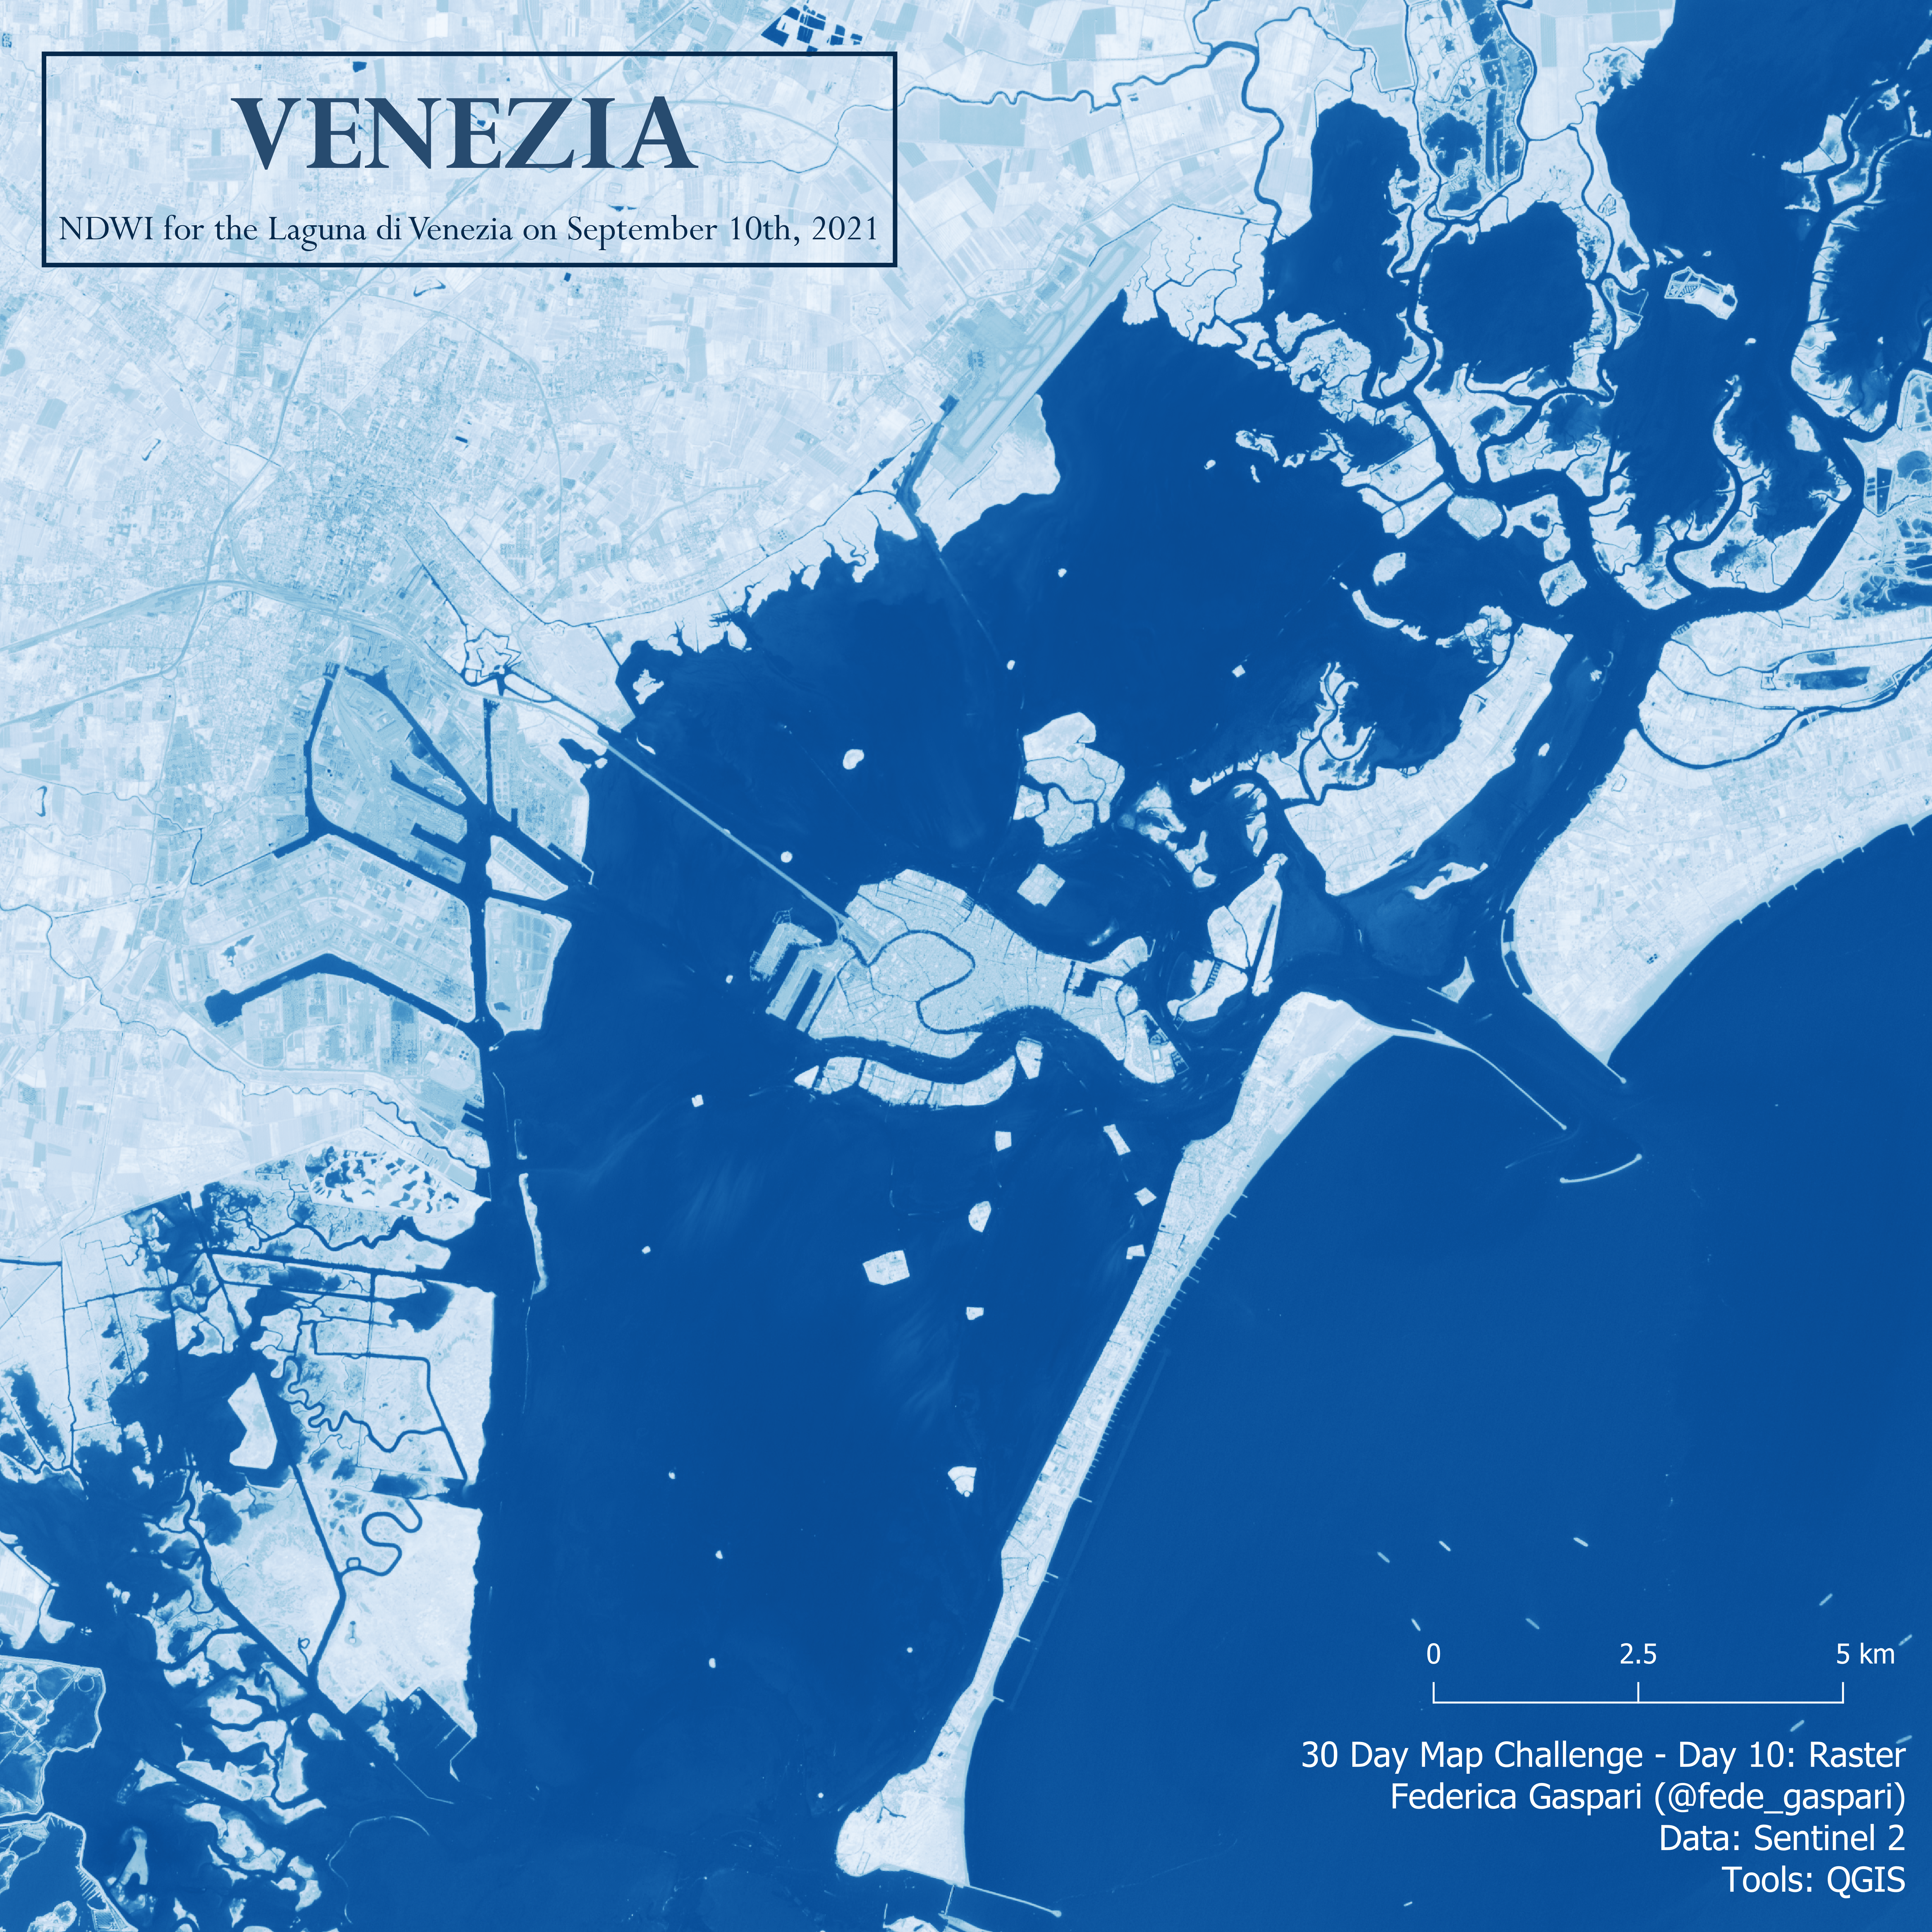
Day 10: Raster
Nothing stops you from doing almost all of the maps with raster data. But this day is dedicated to those lovely pixels.
Raster image of the Laguna di Venezia depicting the NDWI calculated on Sentinel 2 imagery using QGIS.
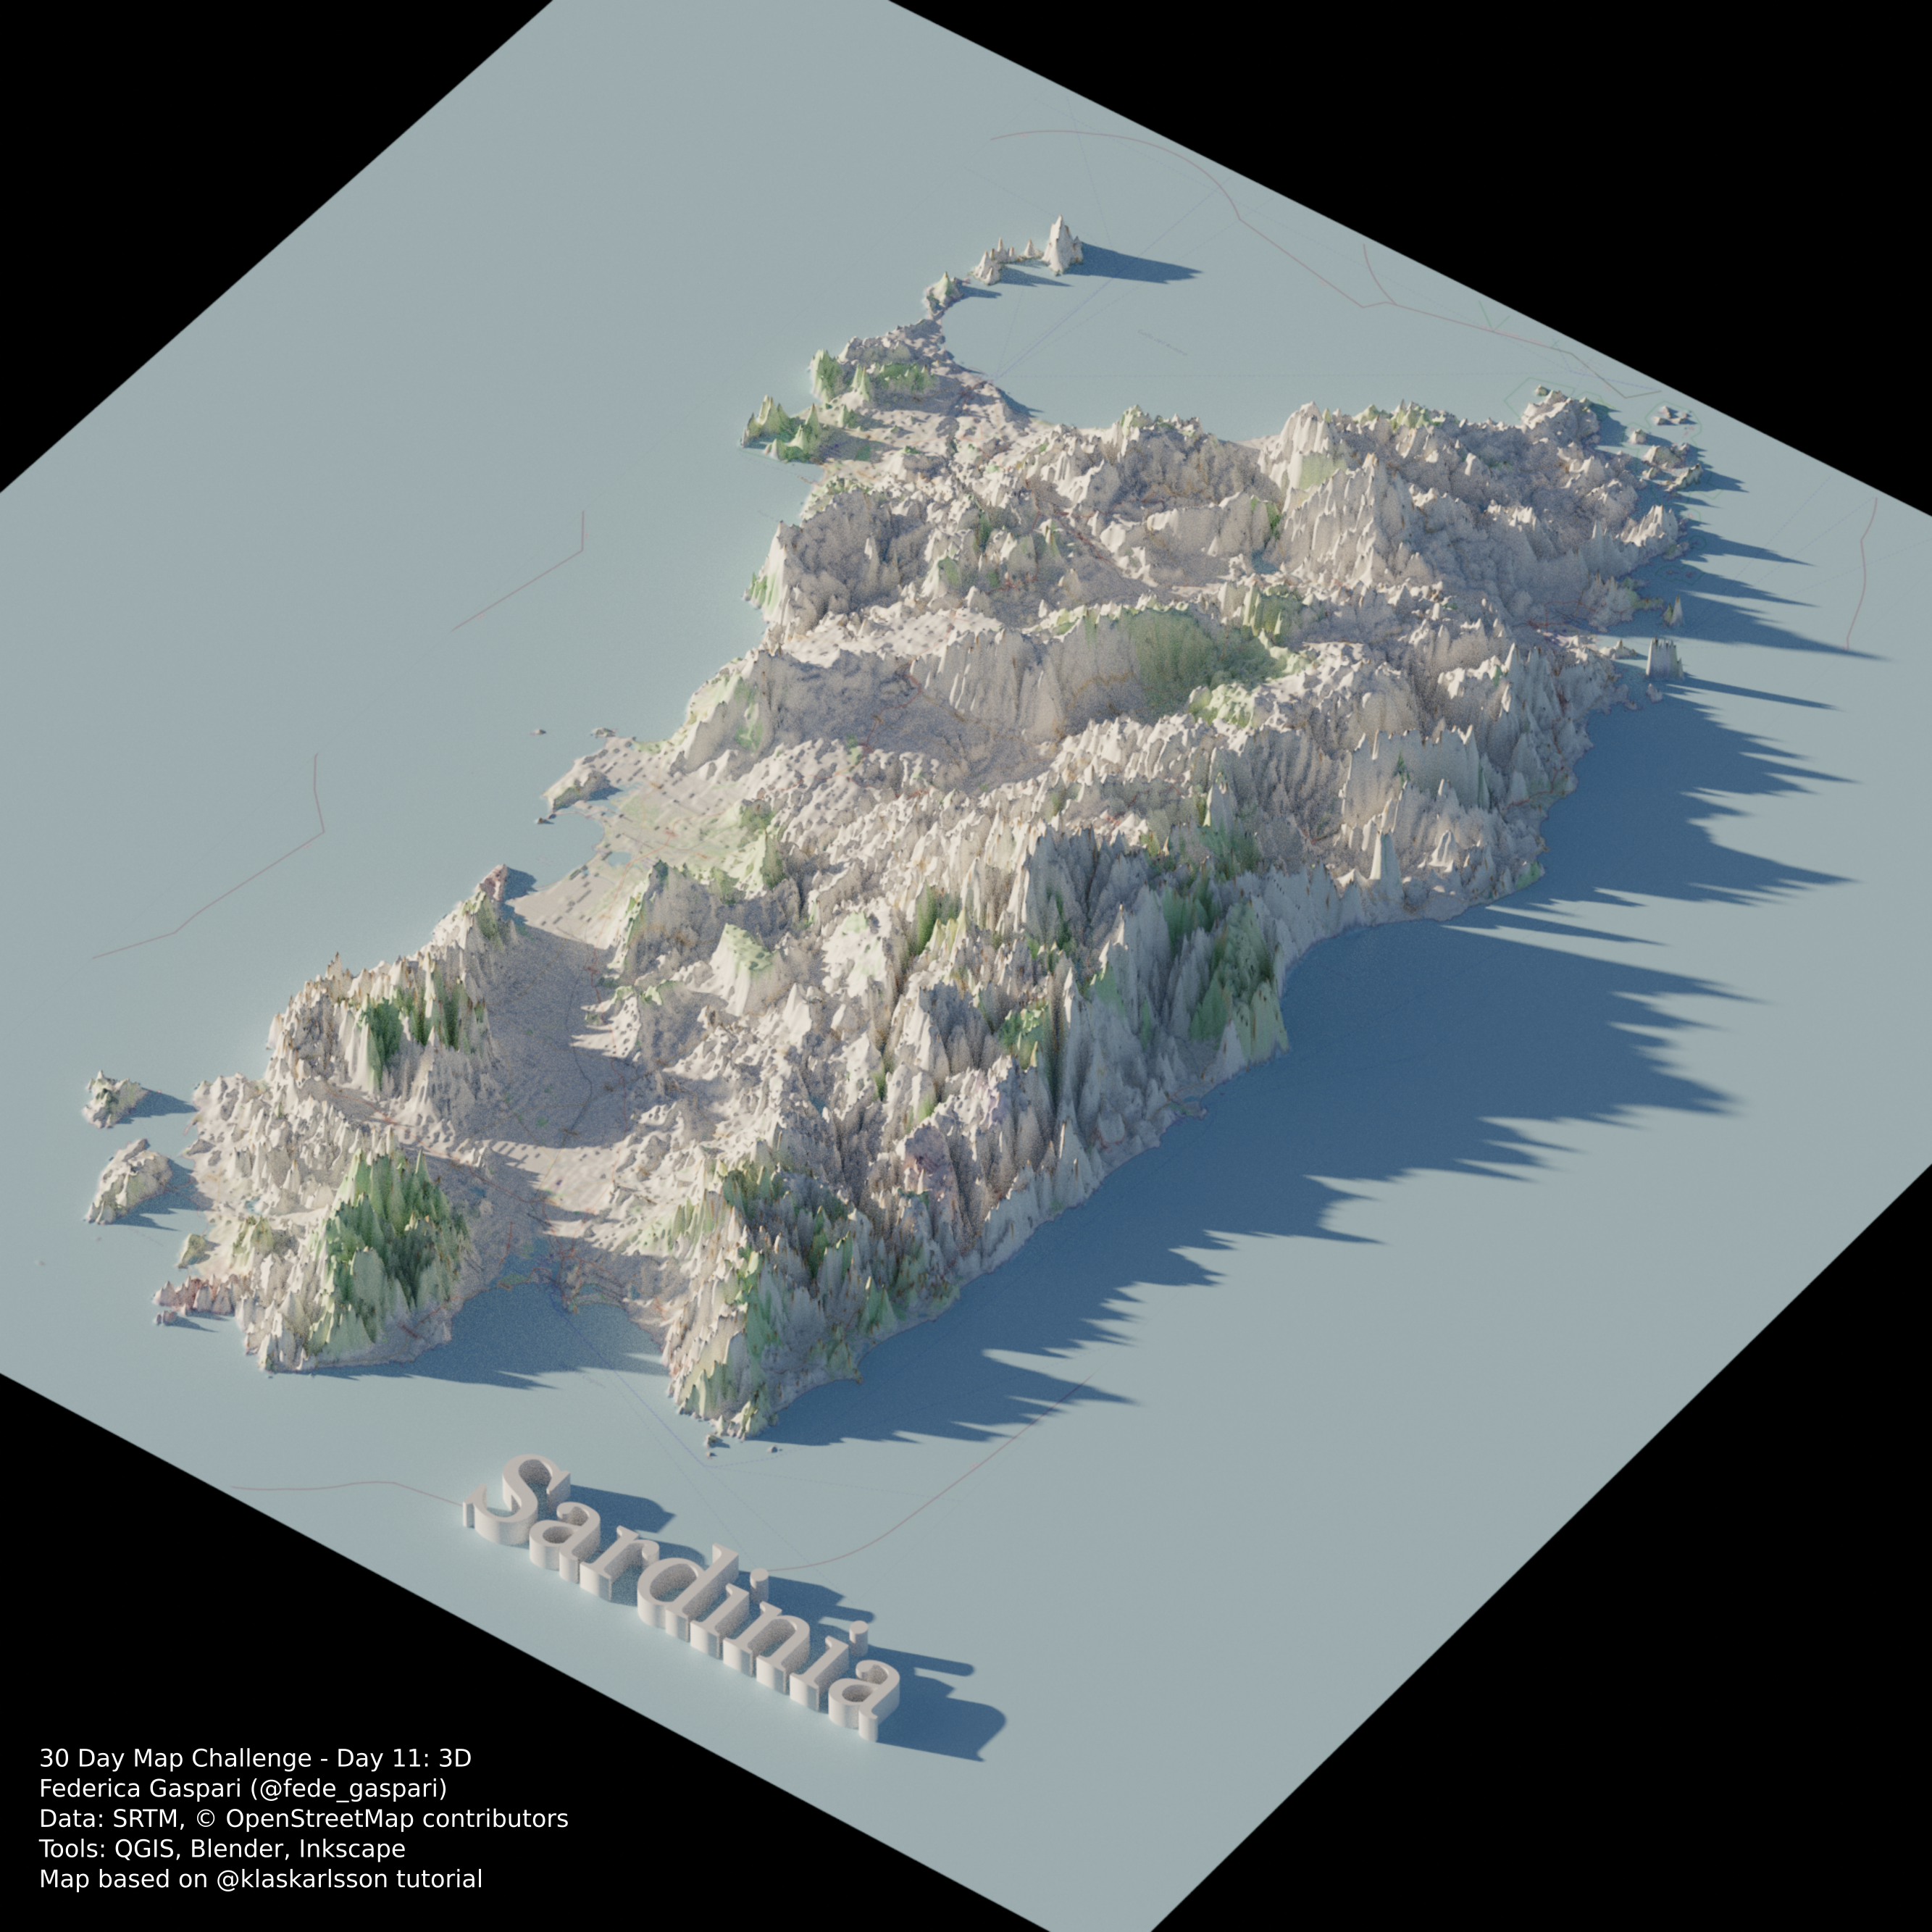
Day 11: 3D
The magnificent third dimension! Visualize something in 3D
3D model of Sardinia rendered in Blender environment. The map was made by following the tutorial by Klas Karlsson using SRTM elevation rasters and OSM data prepared in QGIS and restyled in Blender.
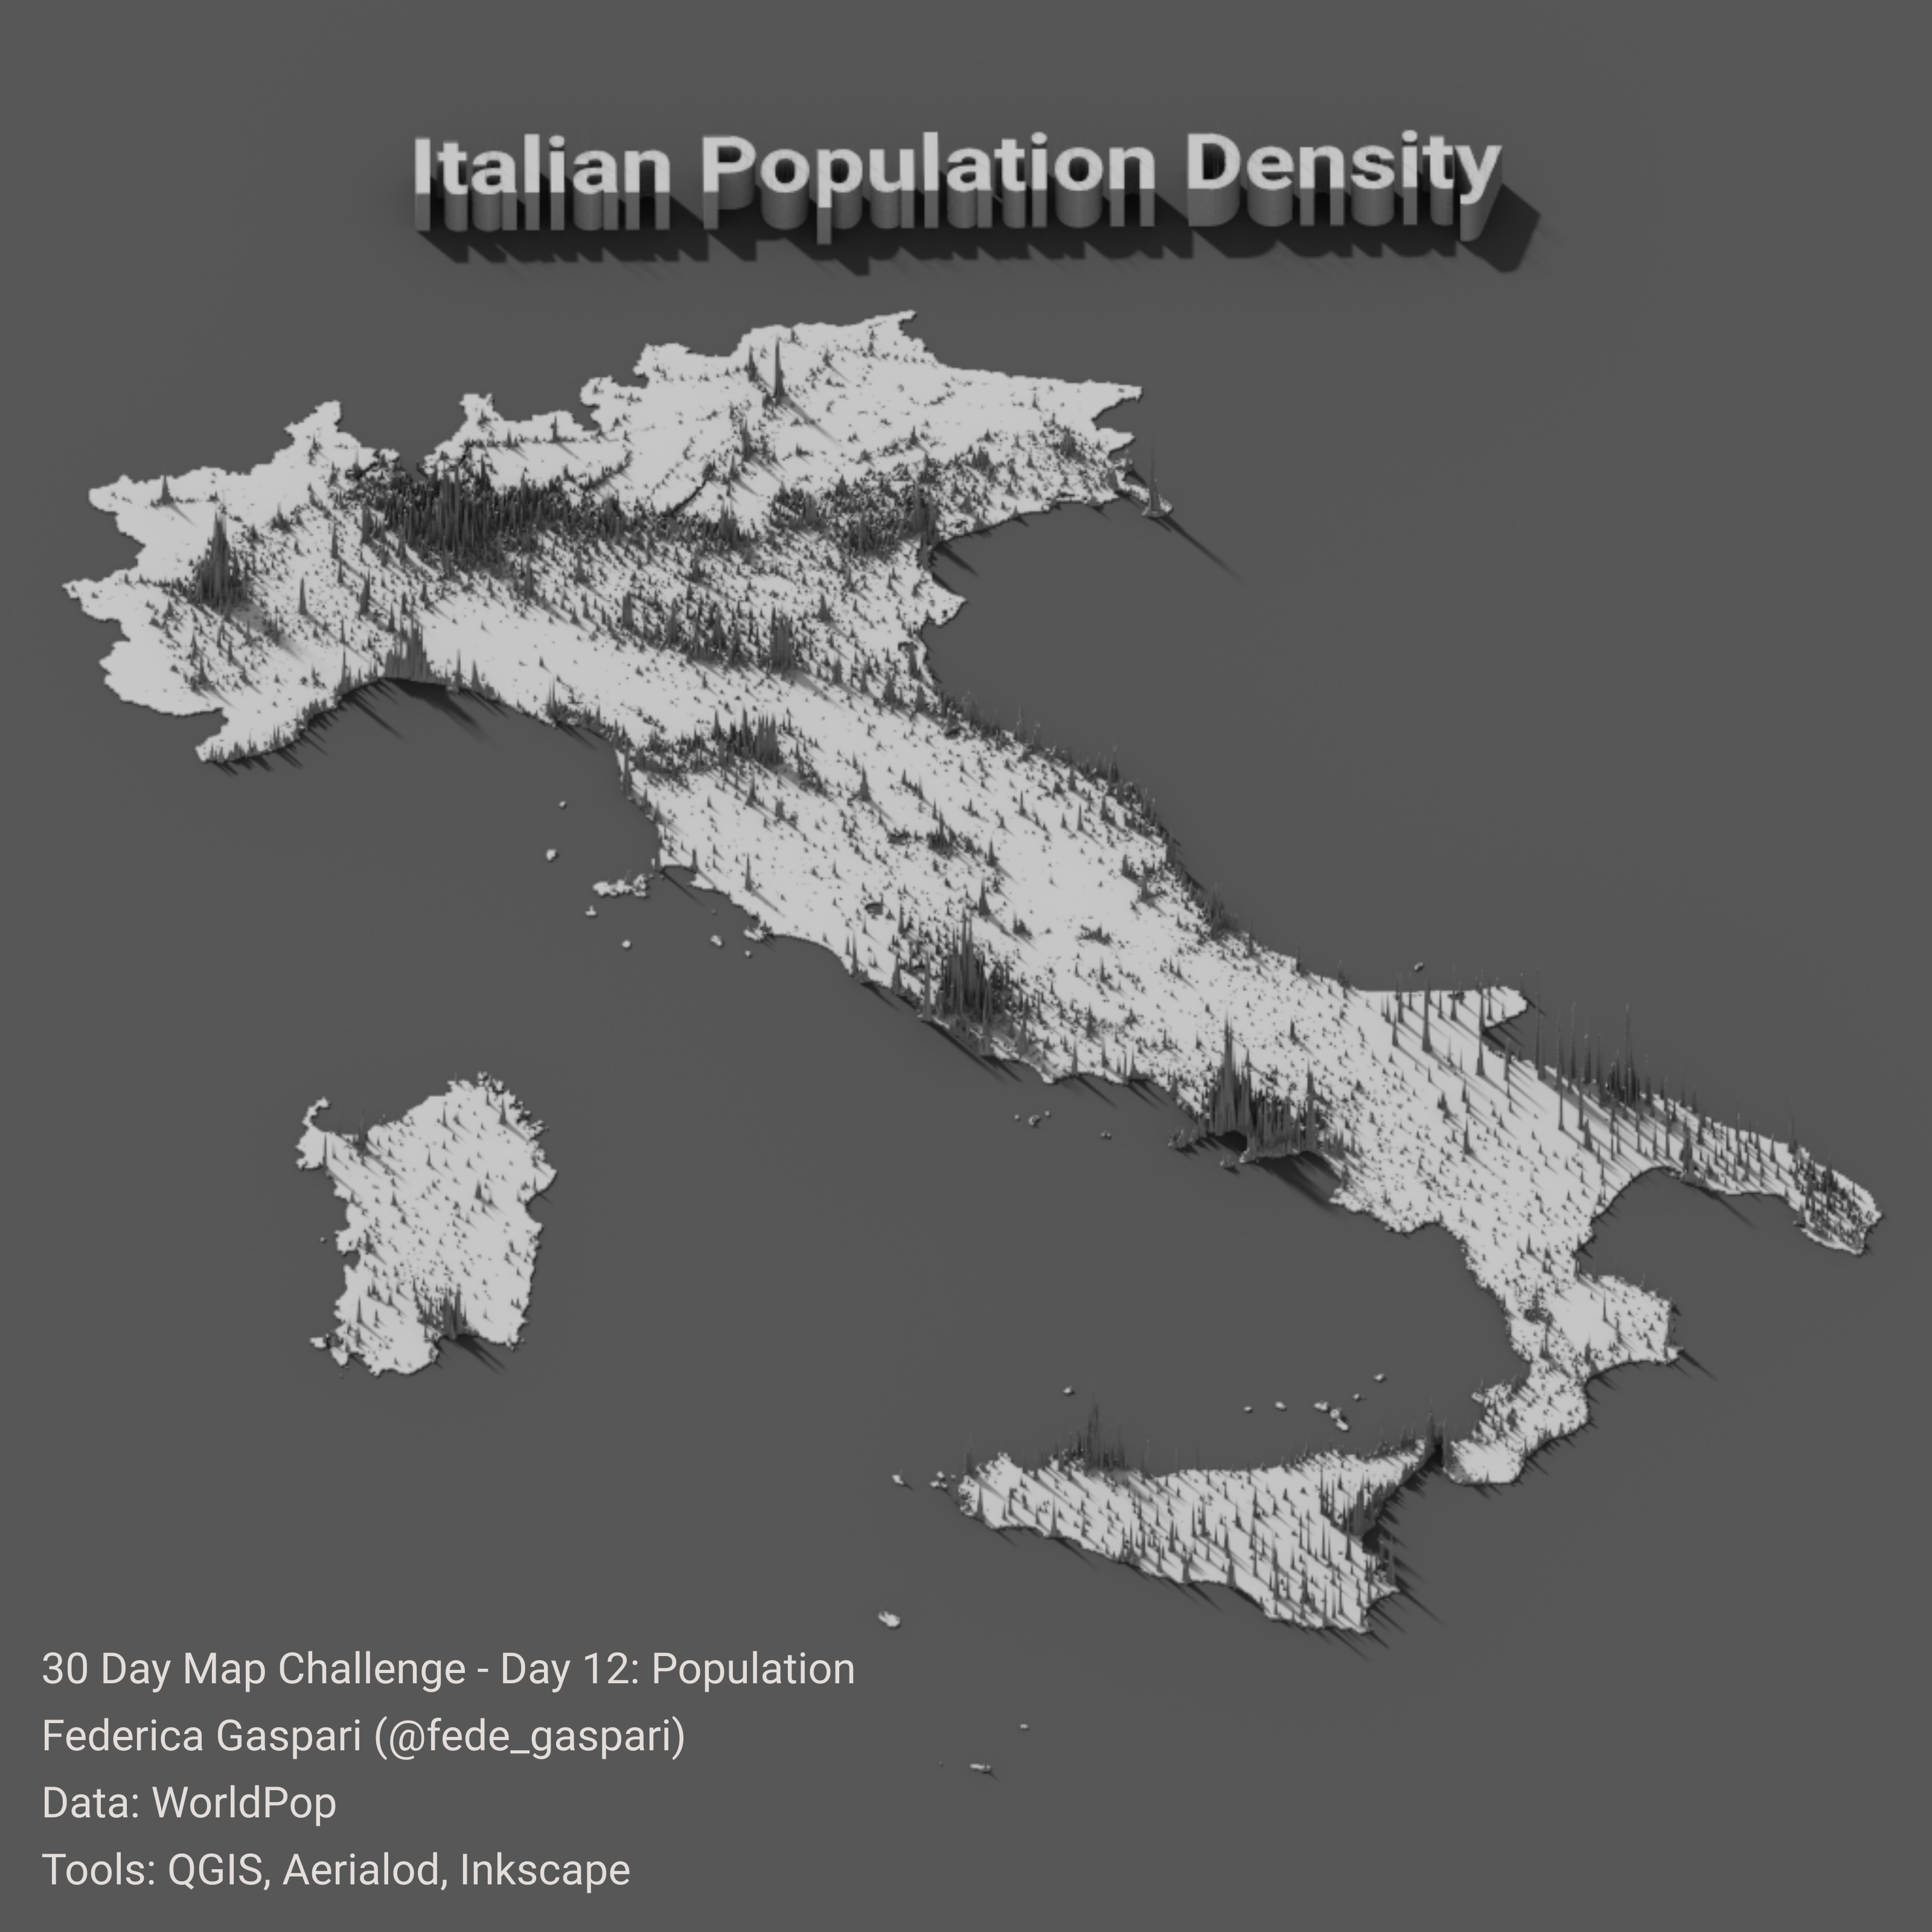
Day 12: Population
A map about human or animal population
2020 Italian Population visualized with Aerialod with data preparation on QGIS and Inkscape. Data from WorldPop.
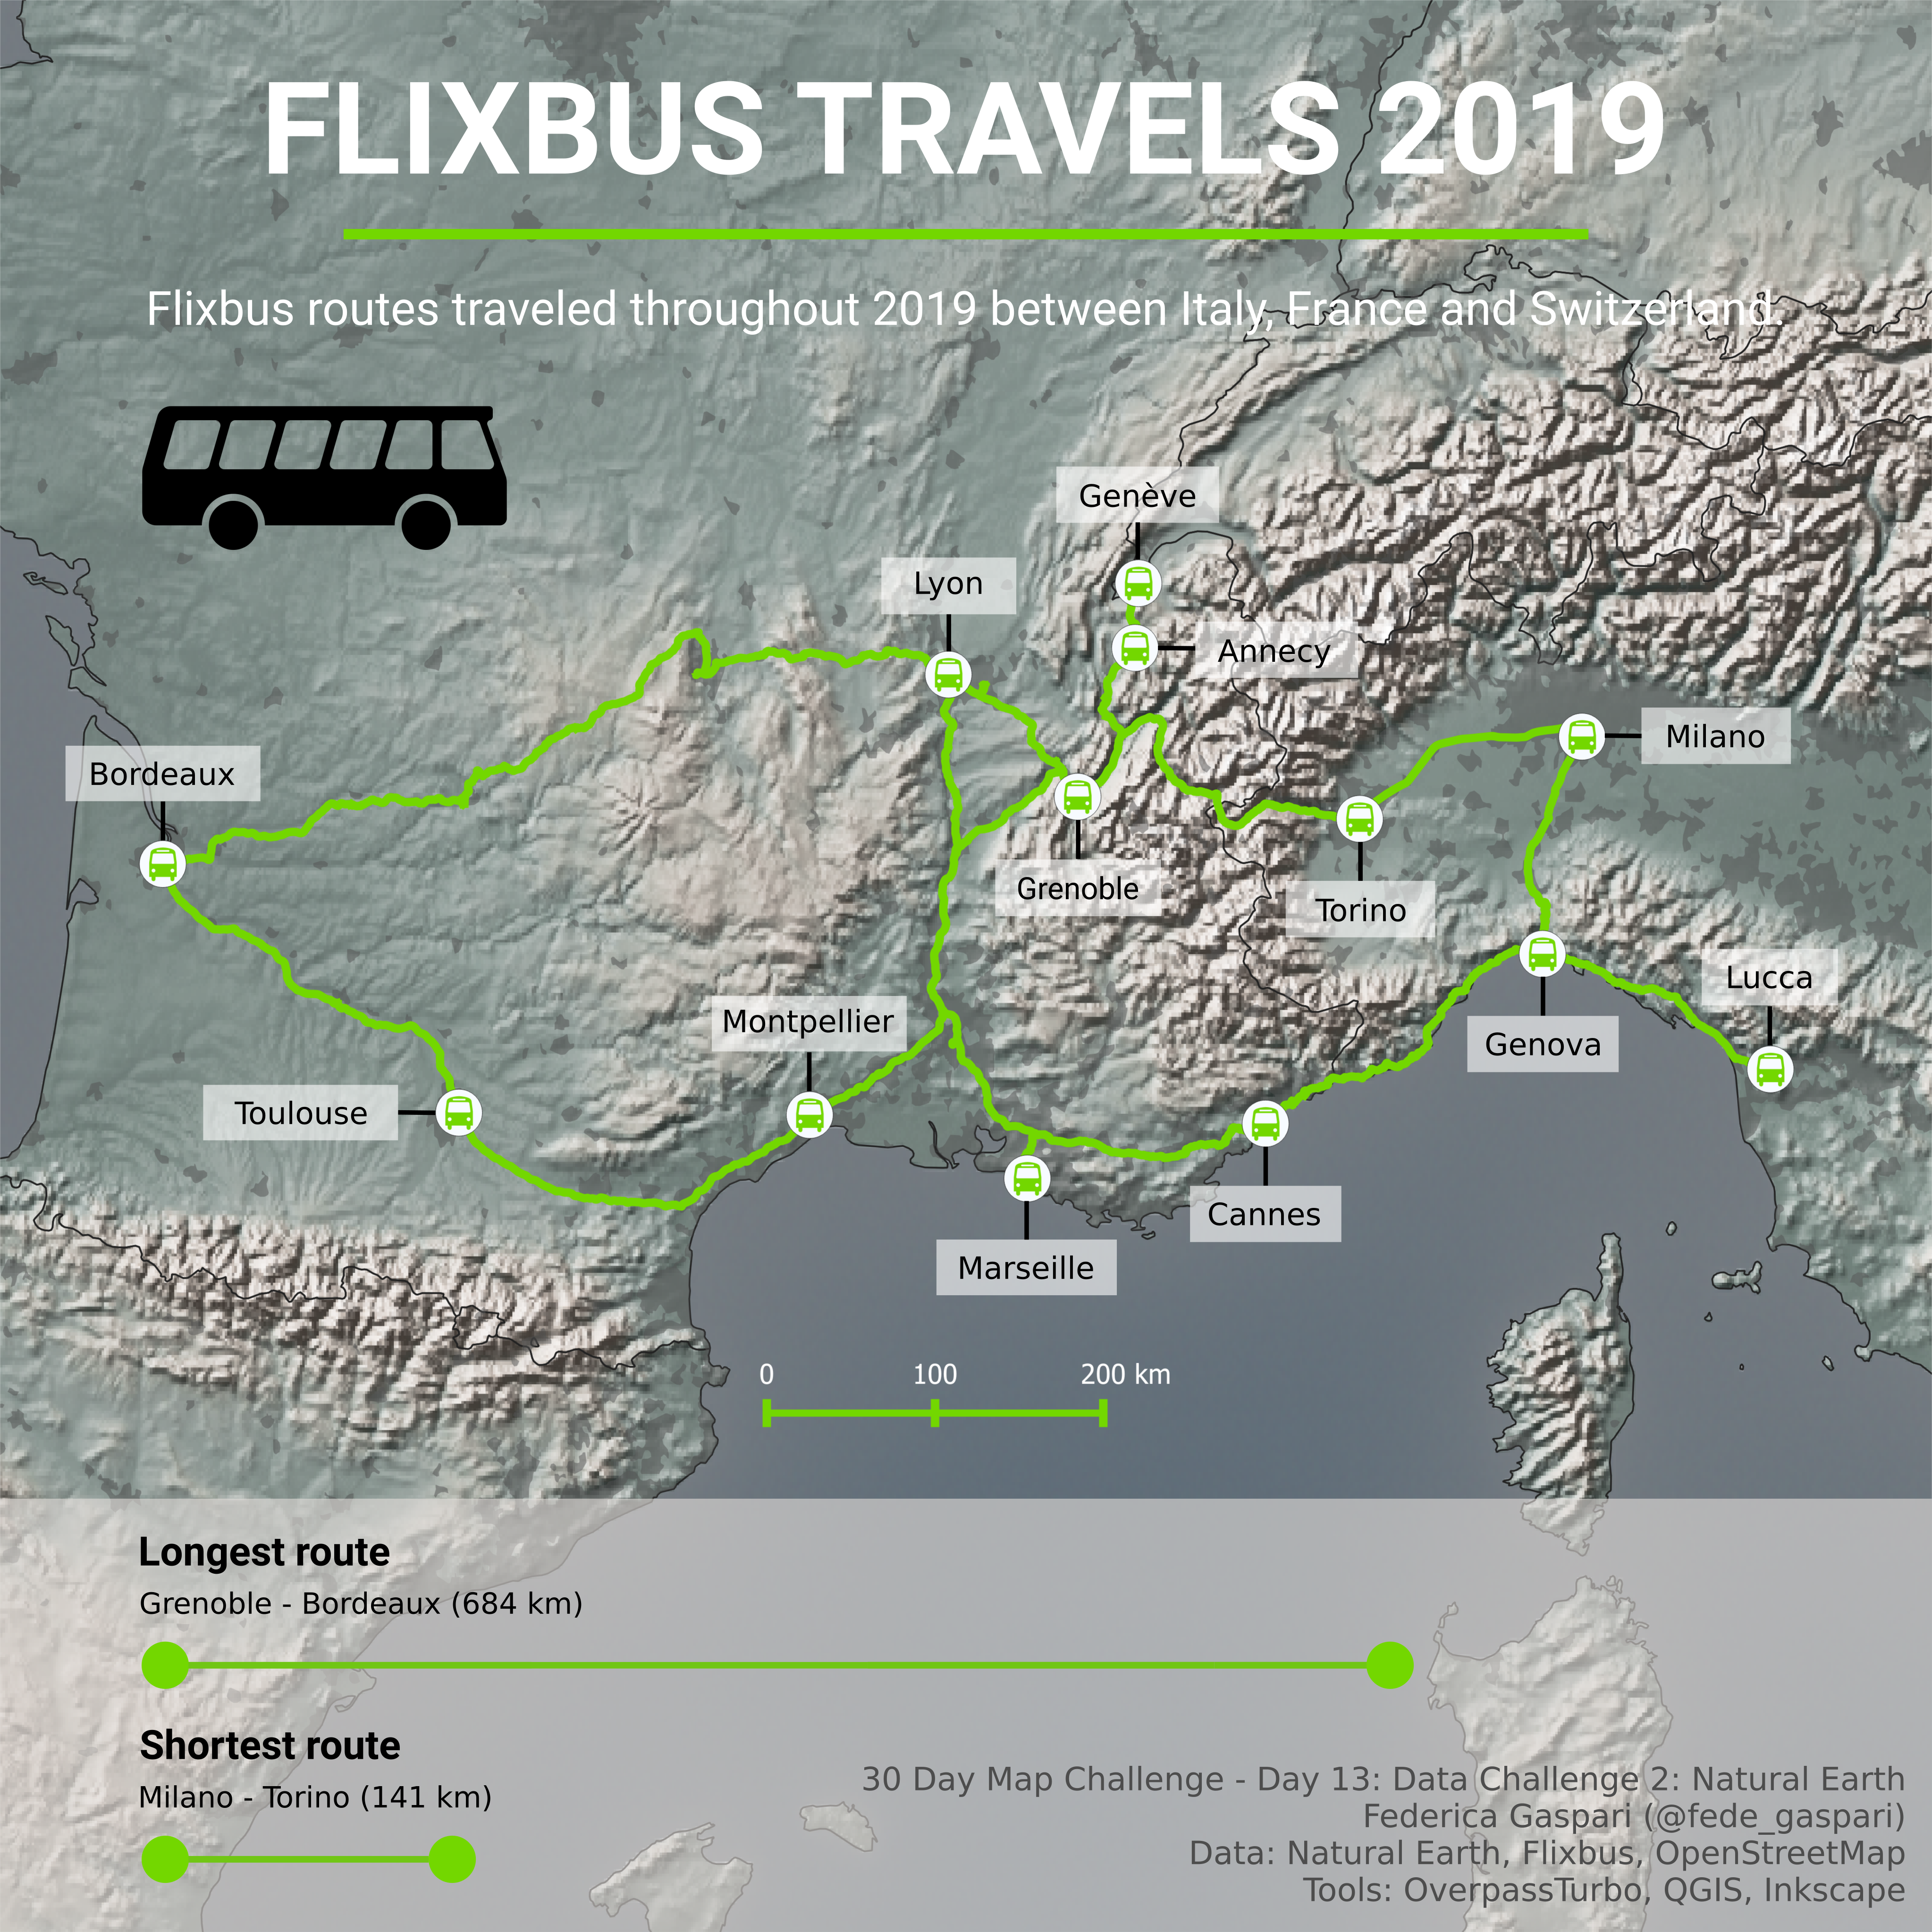
Day 13: Data challenge 2: Natural Earth
Great public domain map dataset for cartography on global and national scales. You can use Natural Earth as a part of your map or as the main source.
A simple map overview of Flixbus routes traveled in 2019. Routes data retrieved from OpenStreetMap and Flixbus account. Basemap, populated areas, cities and boundaries from Natural Earth.
Day 14: Map with a new tool
As the whole #30DayMapChallenge is much about learning and experimenting, this day is dedicated to exploring new tools. See the list on this repo below or find something interesting yourself!
Time series animations of Earth observation imagery representing 20-year median NDVI for serial 16-day MODIS composites spanning January 1st through December 31st. The GIF was made for the Italian territory adapting Google Earth Engine code tutorial made by jdbcode.
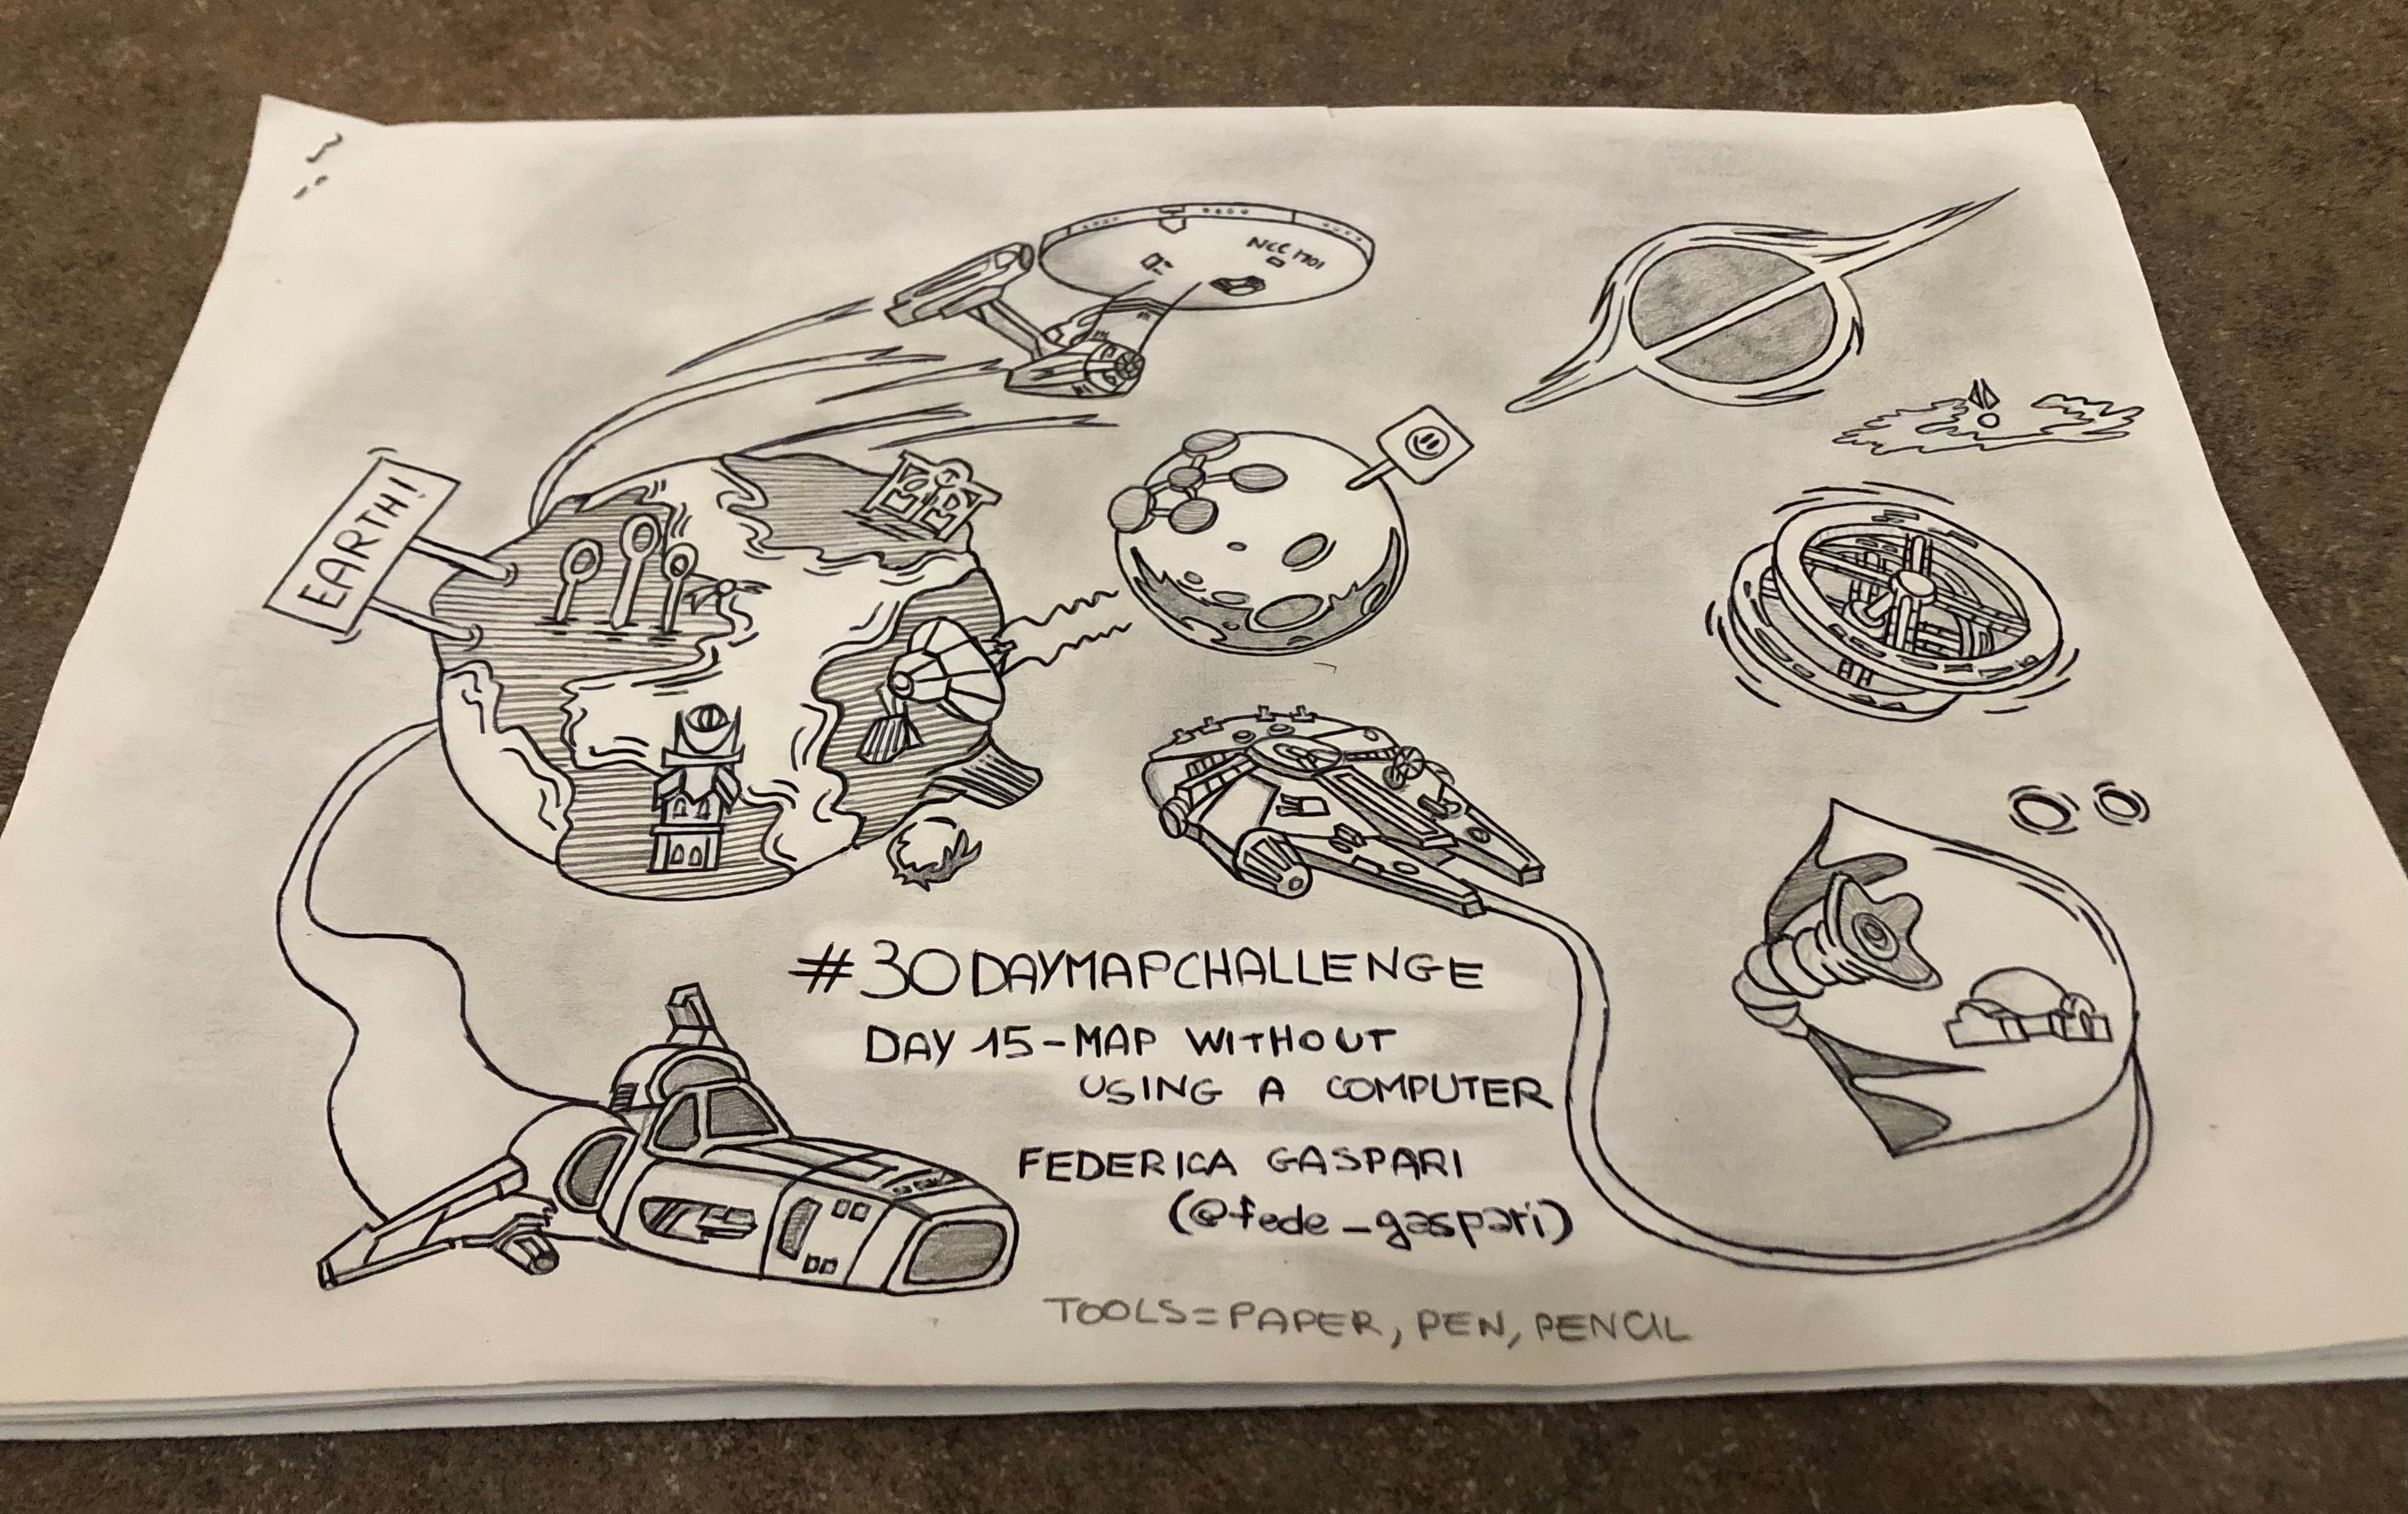
Day 15: Map made without using a computer
Title speaks for itself. Use pen & paper etc…
Geography of some of the most exciting fantasy and sci-fi adventures from movies, TV series and books. Tools… Paper, pen and pencil! Data: Harry Potter, The Lord of the Rings, Arrival, Contact, Narnia, Star Trek, Artemis, Moon, Battlestar Galactica, Star Wars, Interstellar, Foundation, 2001: A Space Odyssey, Dune
Day 16: Urban/rural
Map an urban area or rural area. Or something that defines that place.
Artificial and agricultural surfaces evolution between 1954 and 2018 in the Cremona municipality according to landuse data from GeoPortale Regione Lombardia. Experimenting with QGIS Atlas by field.
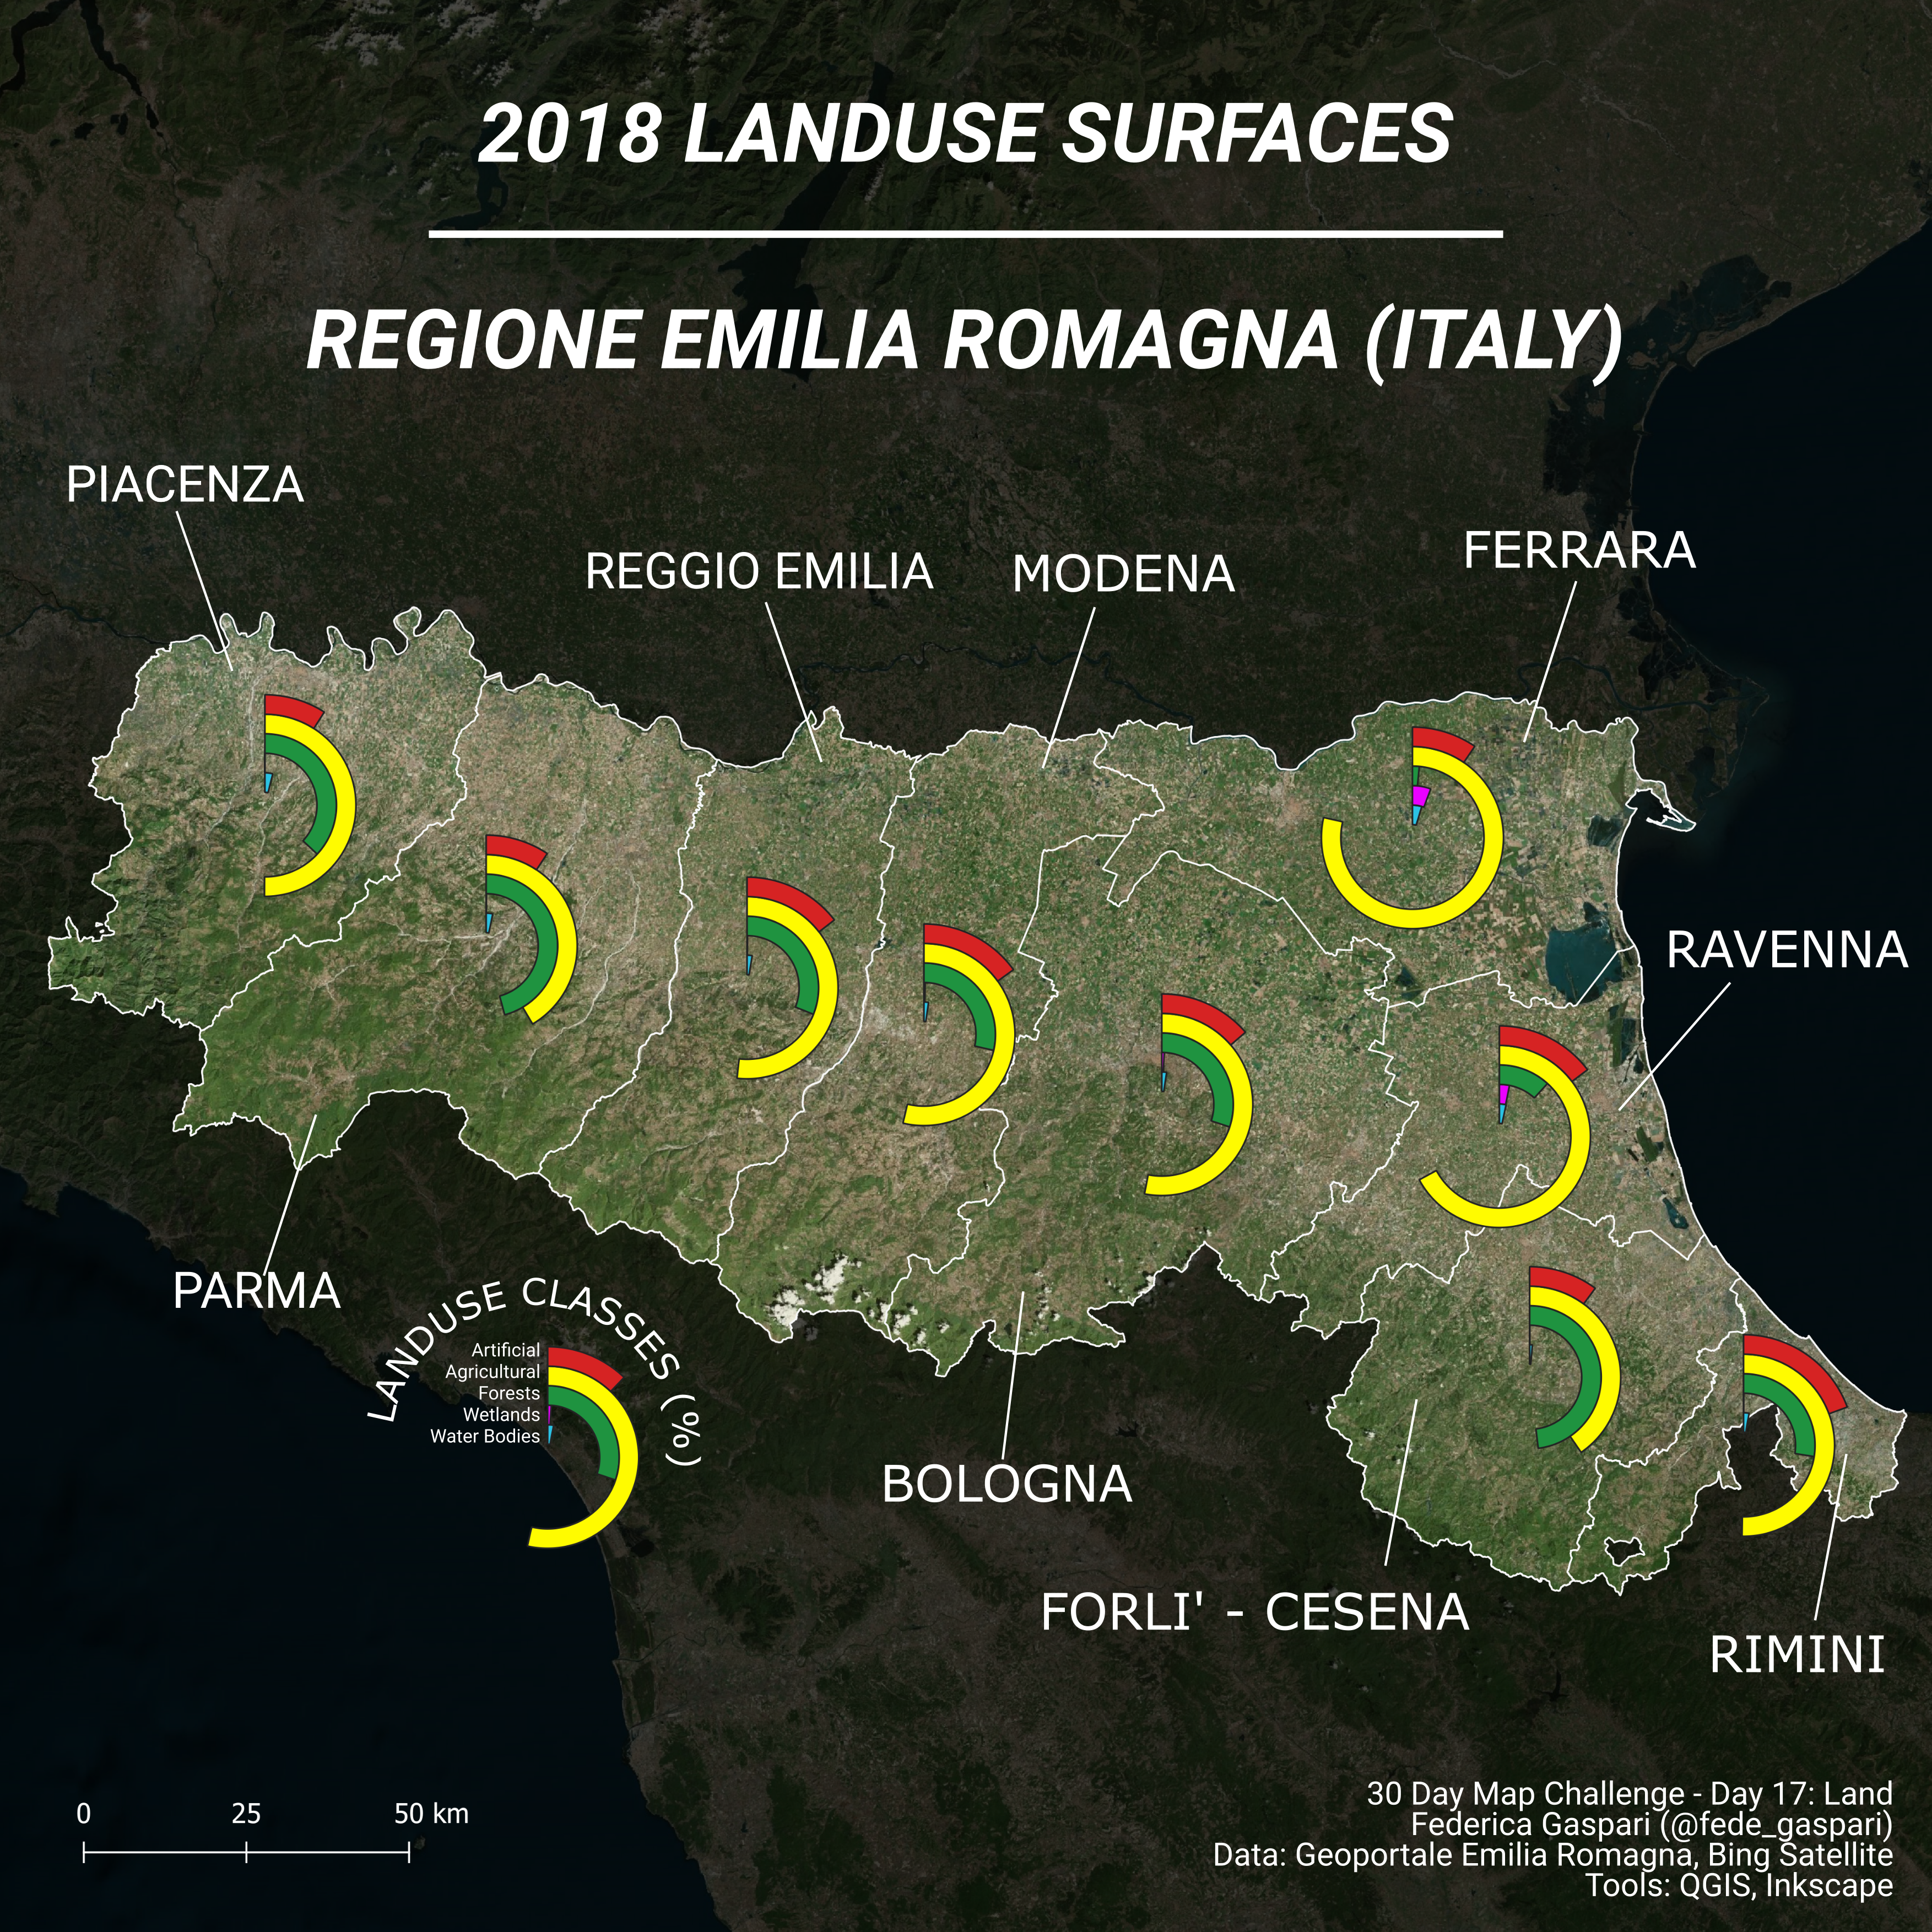
Day 17: Land
Land, landcover, landuse…
Landuse surfaces for Emilia Romagna Provinces in 2018 with data from Geoportale Emilia Romagna and Bing Satellite. The map style was inspired by the great work done by rxlacroix.
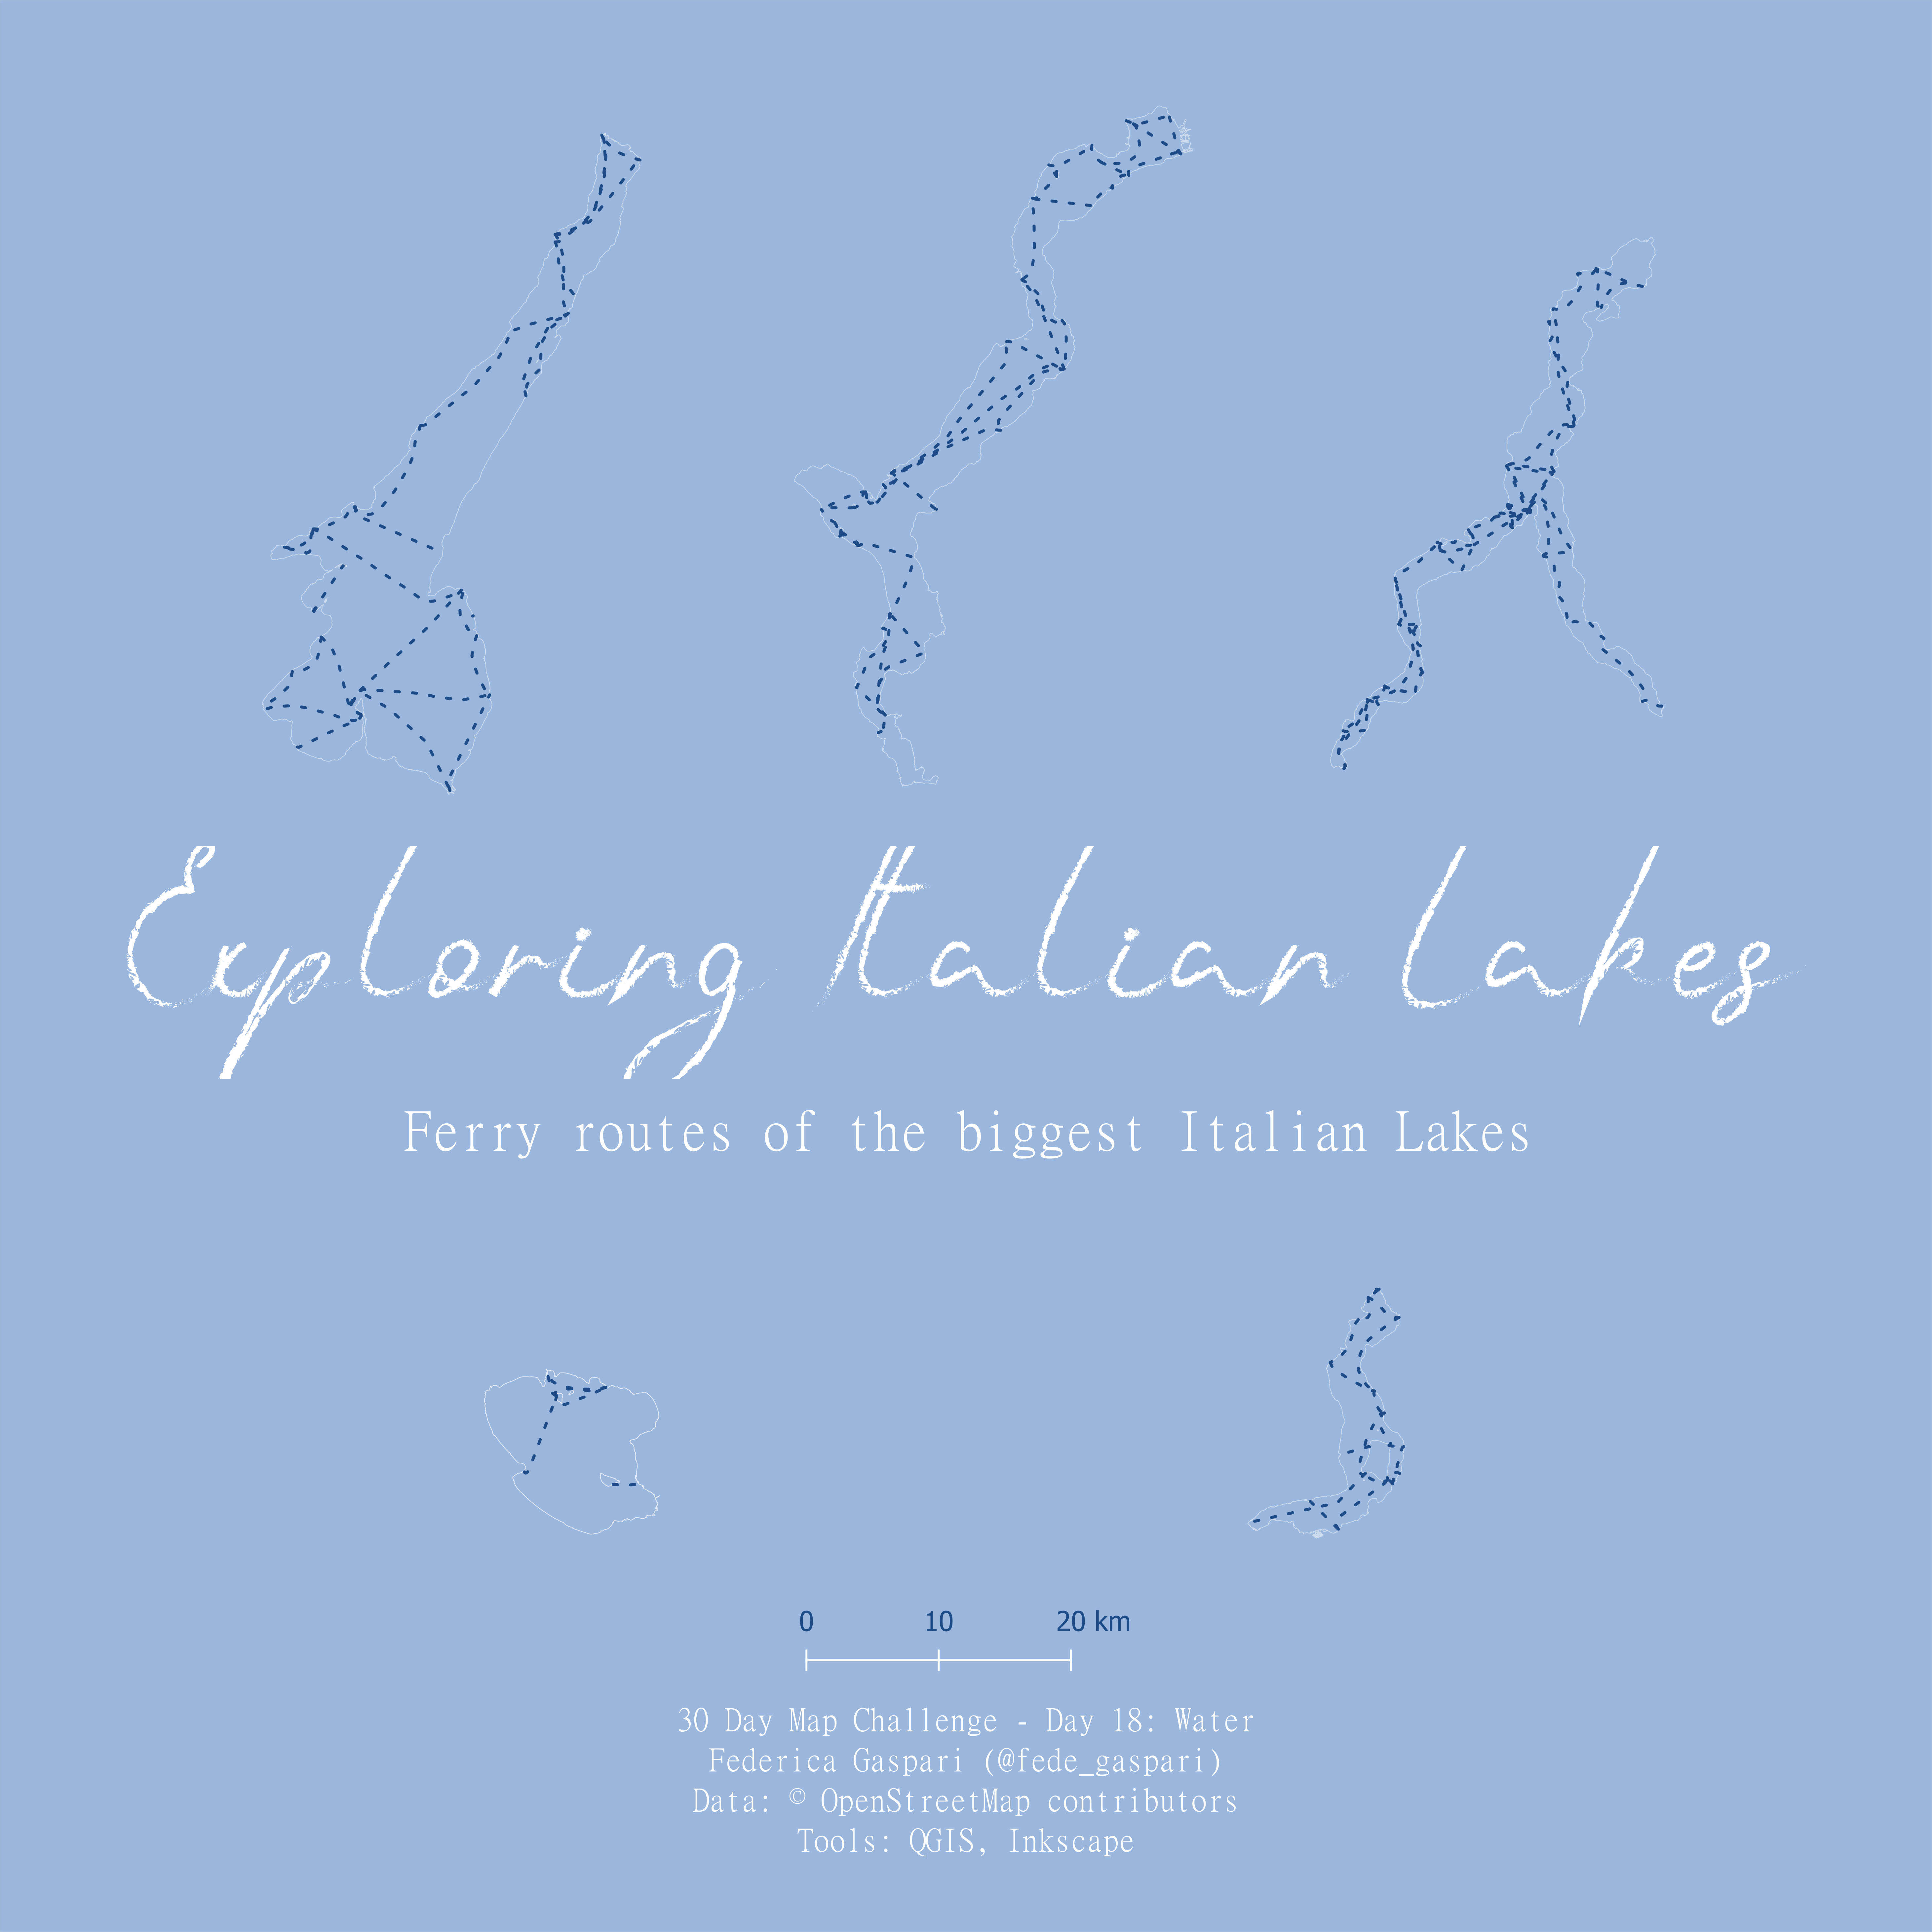
Day 18: Water
Oceans, lakes, rivers or something completely different.
Italian “lake shapes” starting from ferry routes mapped on OpenStreetMap. Tools: QGIS + Inkscape
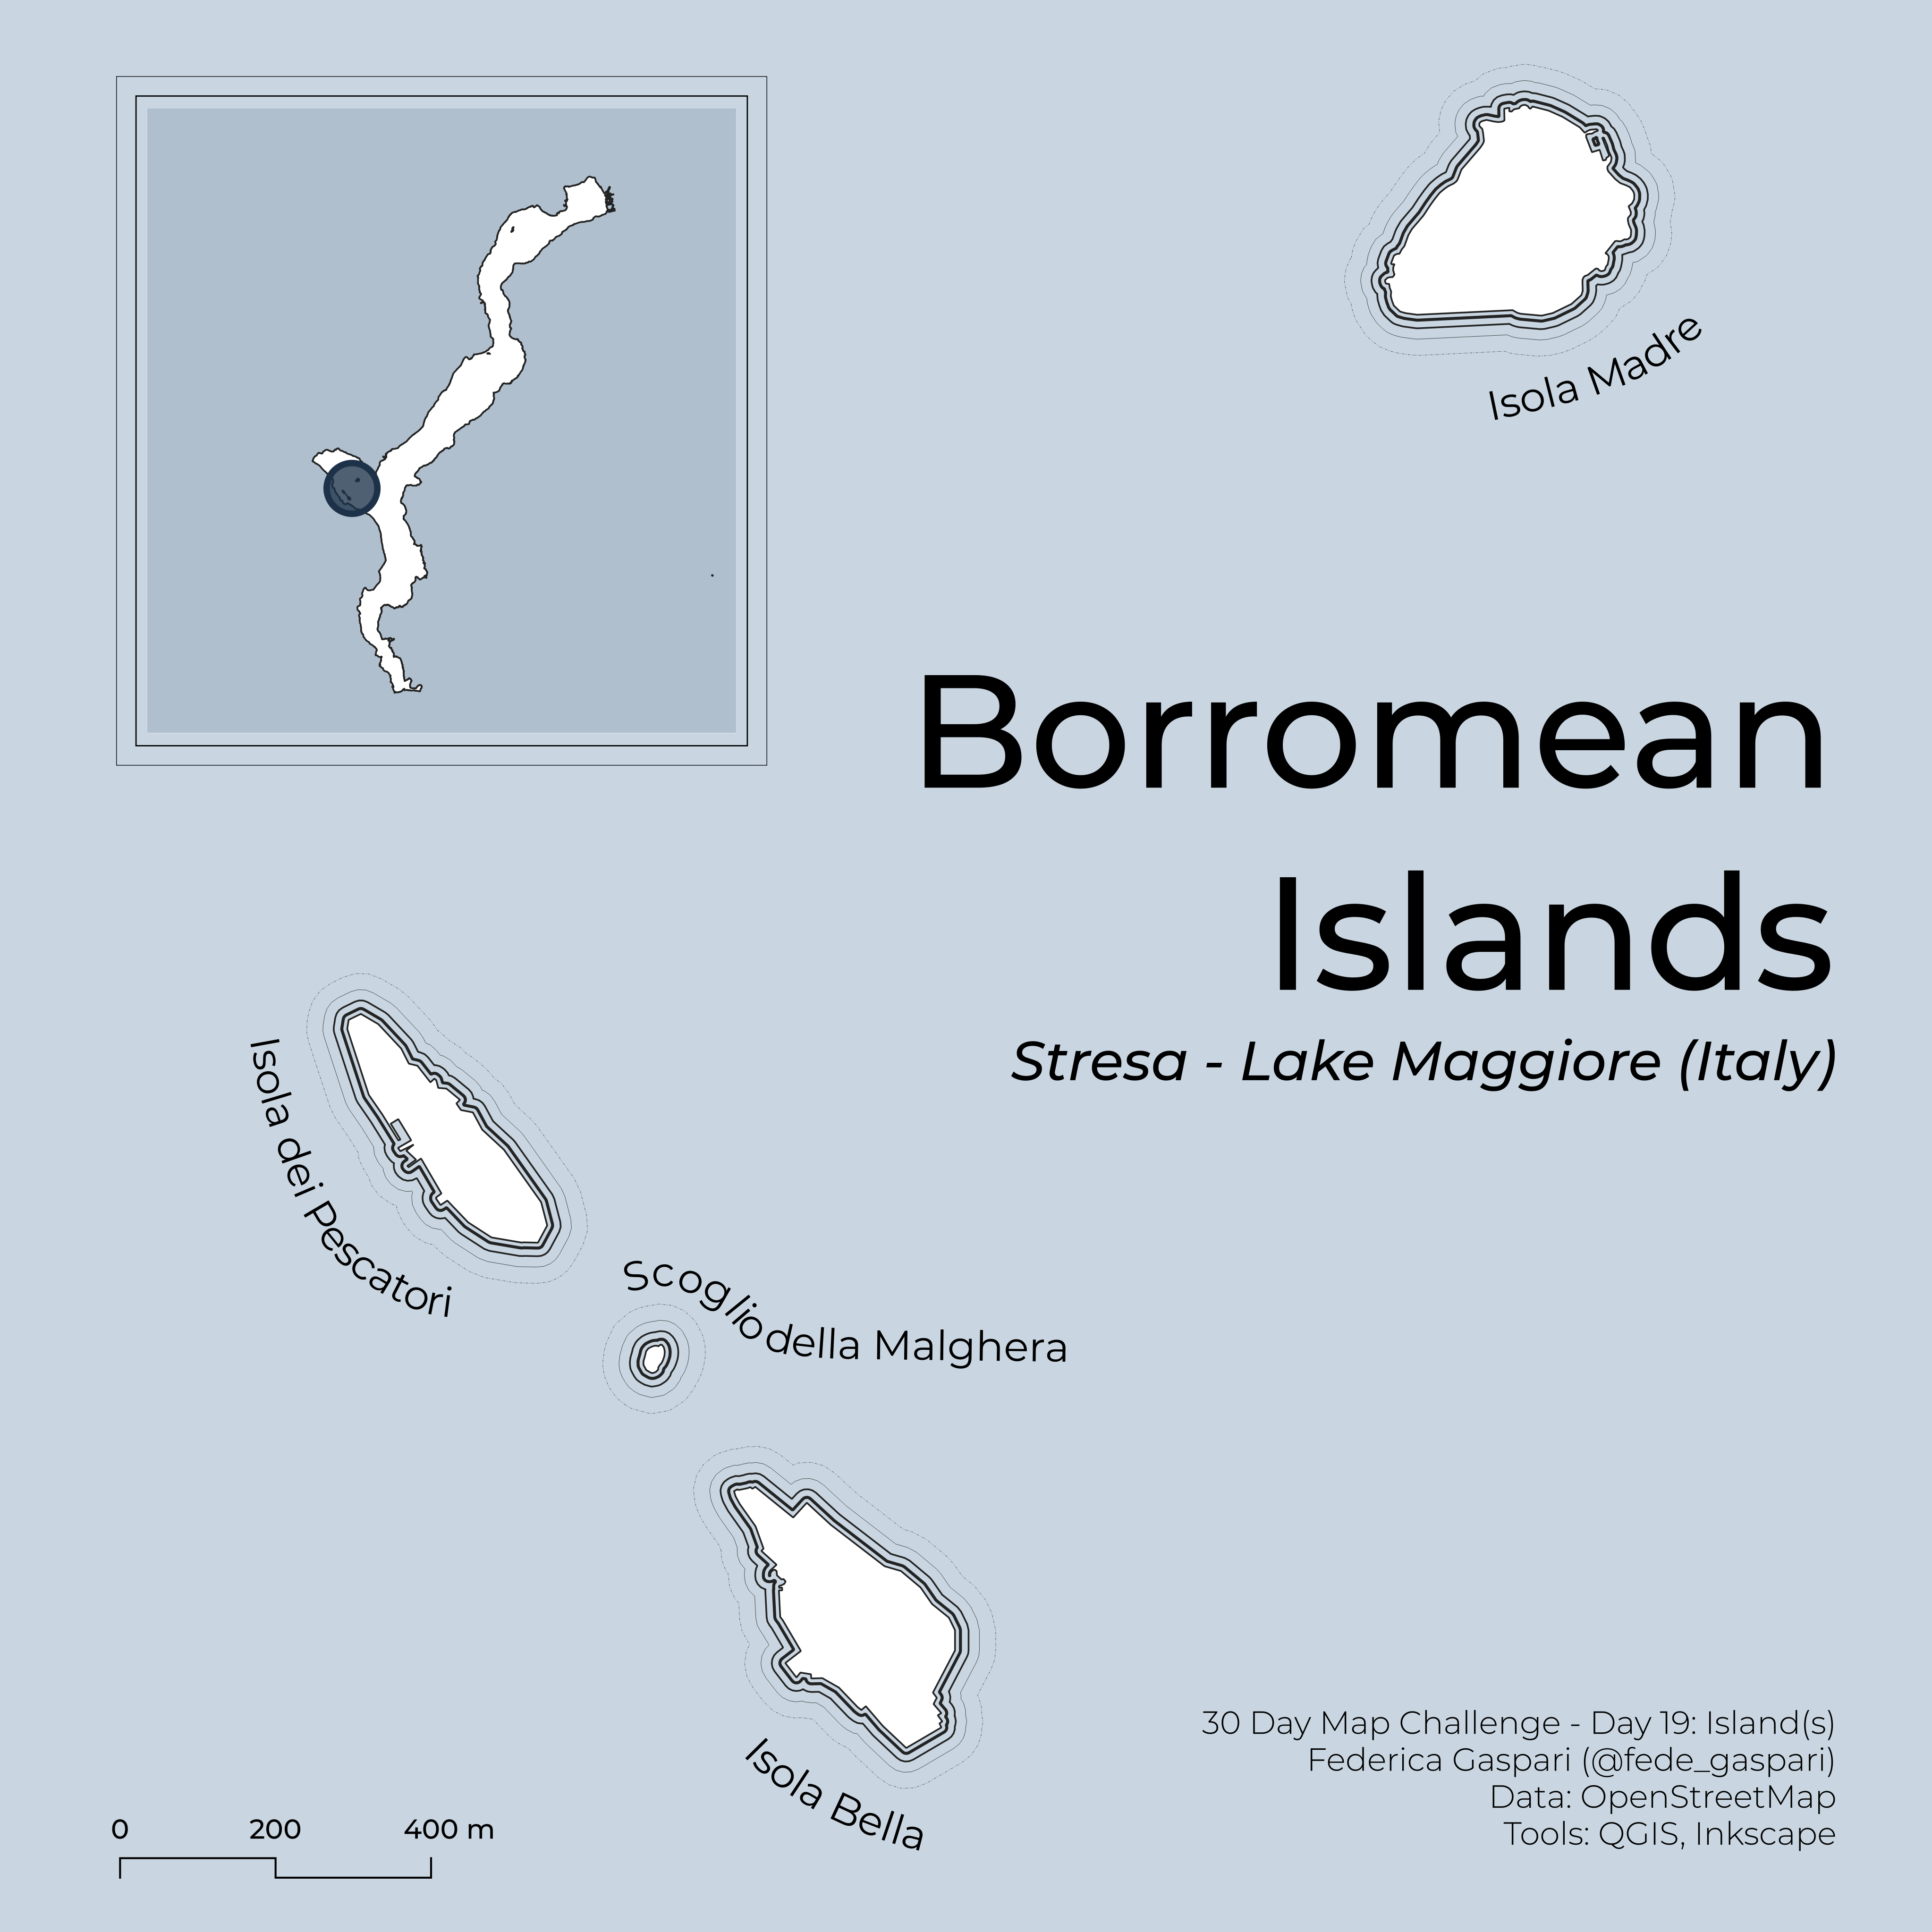
Day 19: Island(s)
Islands in the water, islands of innovation or something completely different.
Borromean islands in Stresa (Italy) visualised with QGIS and Inkscape adapting waterlines style by jakob.listabarth.
Day 20: Movement
Visualizing movement can be done with a static map or with an animation.
Animation of gpx track of Stage 20 of Giro d’Italia 2021 using data from La Flamme Rouge, OpenStreetMap, SRTM and Bing Satellite. The final gif was the results of QGIS Atlas settings made by experimenting with Topi Tjukanov blog post about Geospatial animation with QGIS Atlas.
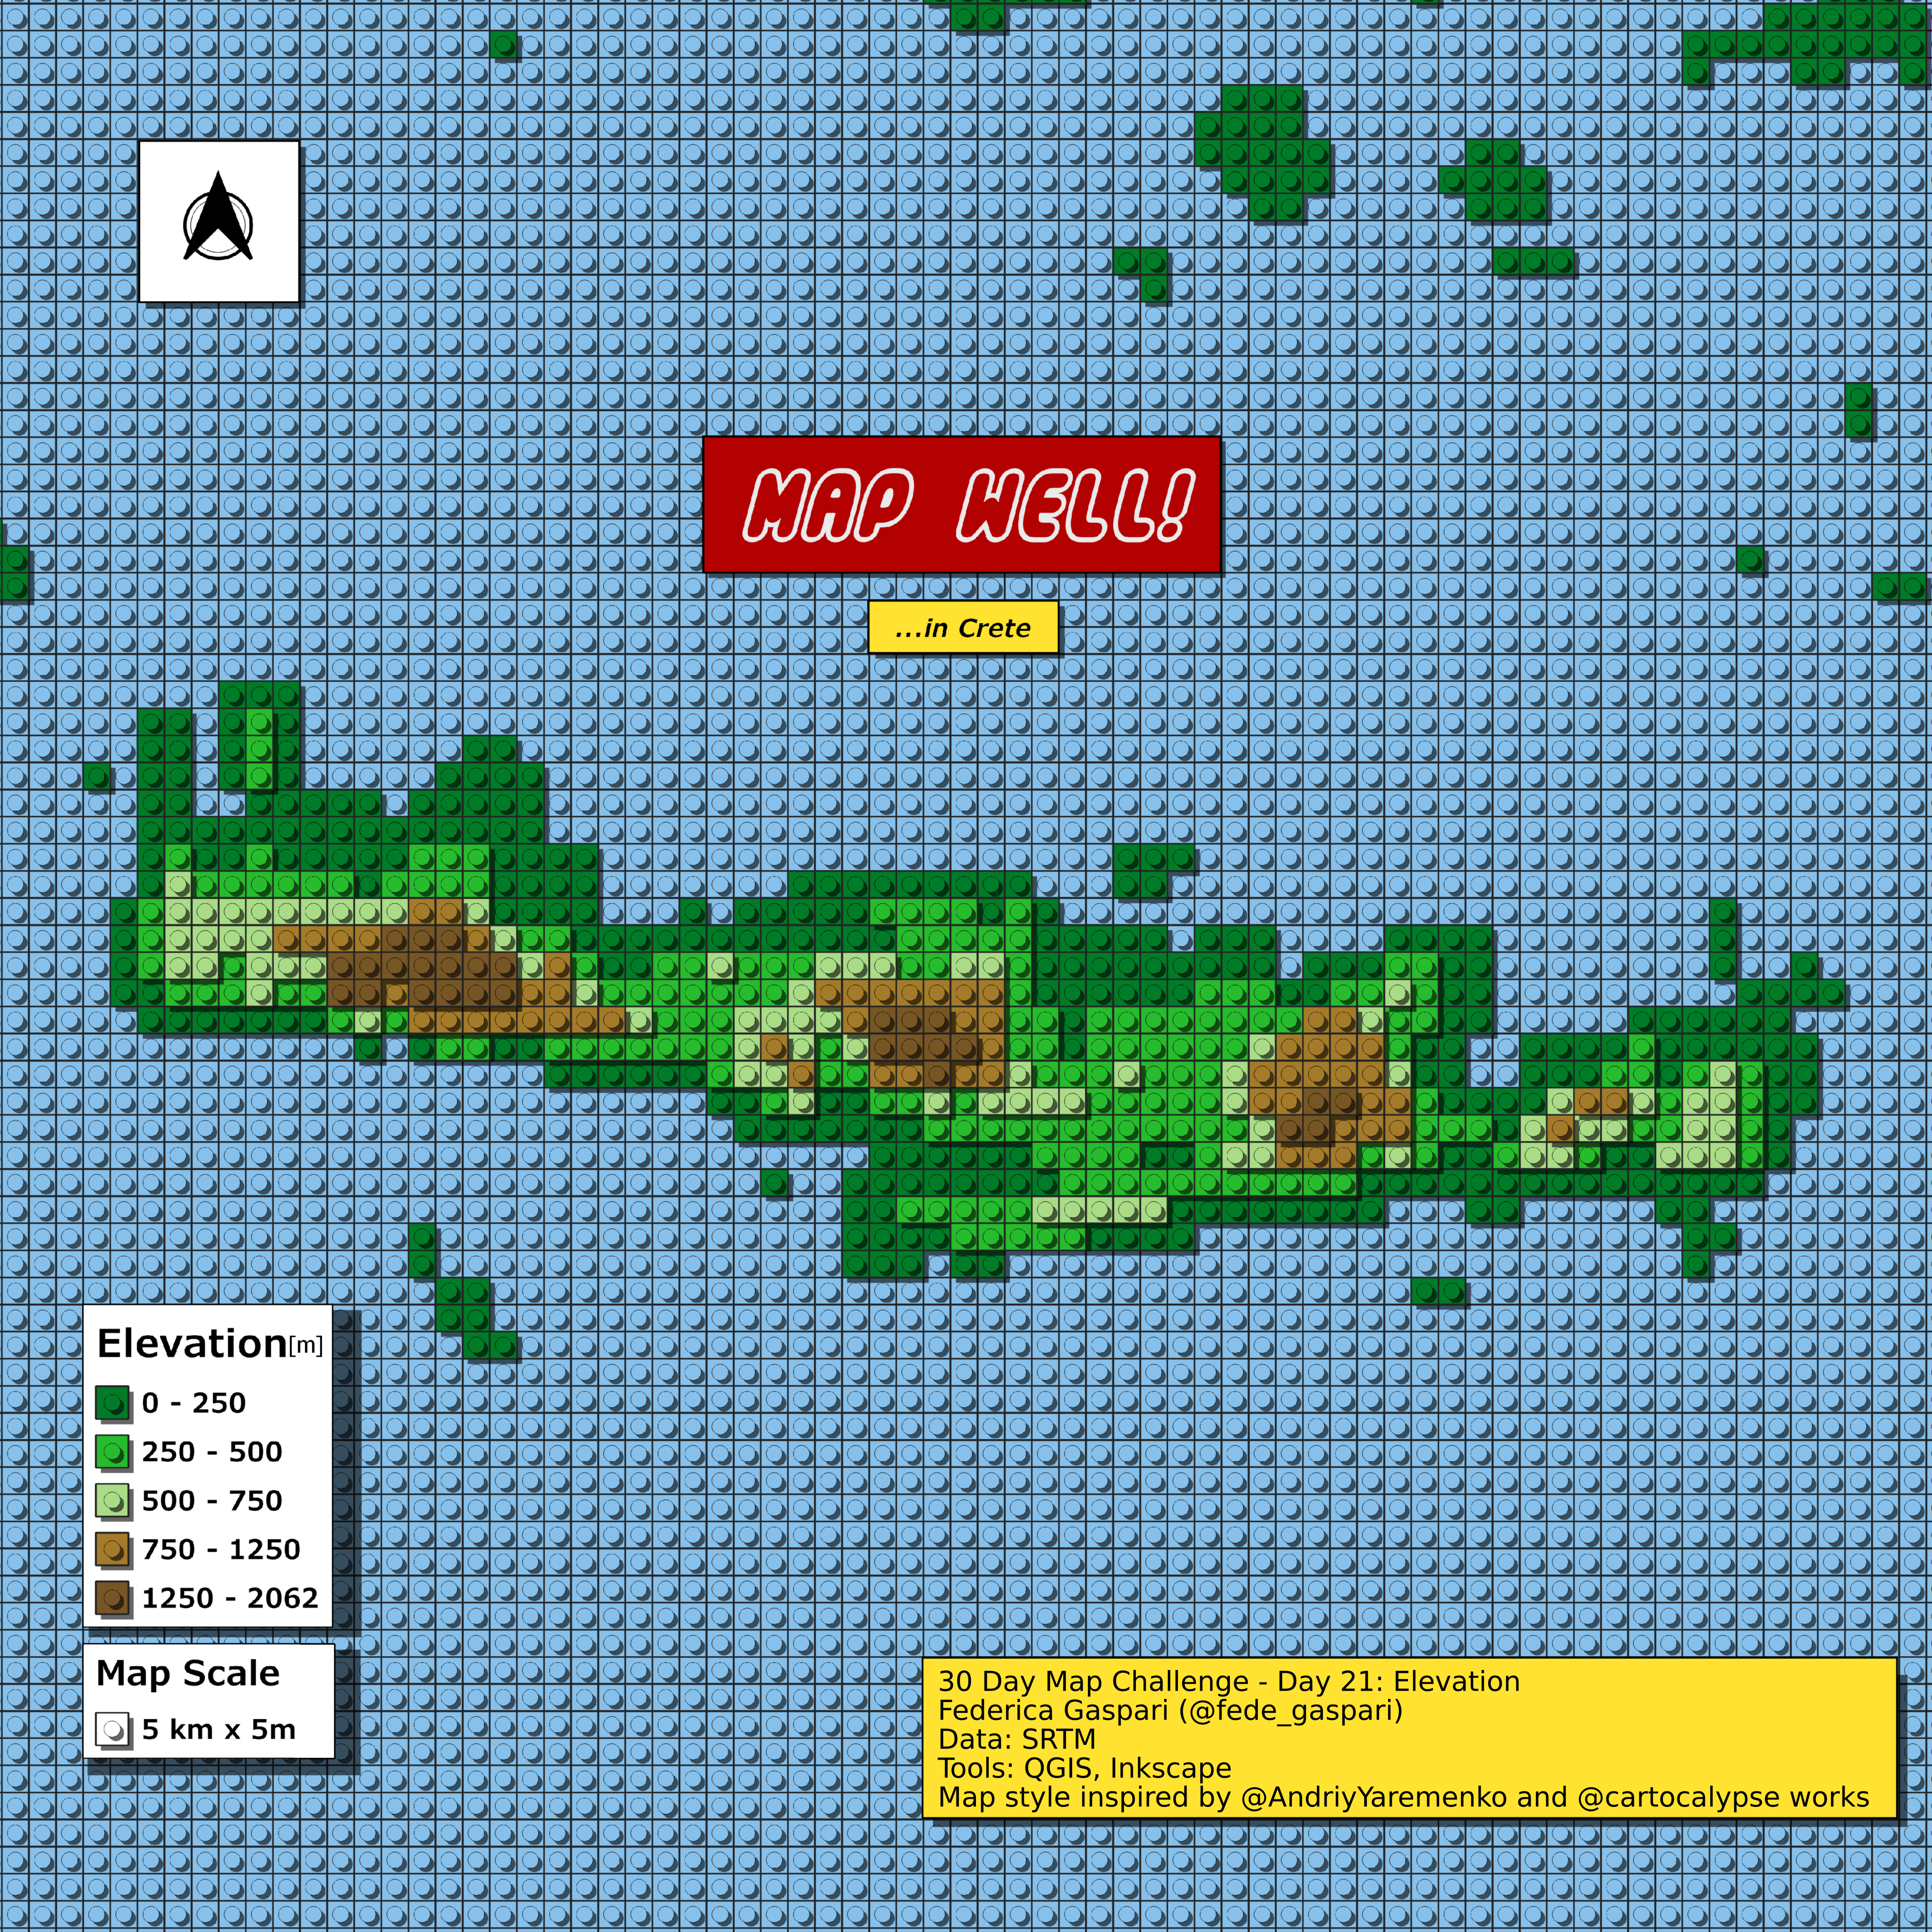
Day 21: Elevation
Sweet hillshades, beautiful contours, high mountains or low valleys.
Elevation map of the island of Crete in the LEGO style inspired by Andriy Yaremenko and hannes.enjoys tutorials.
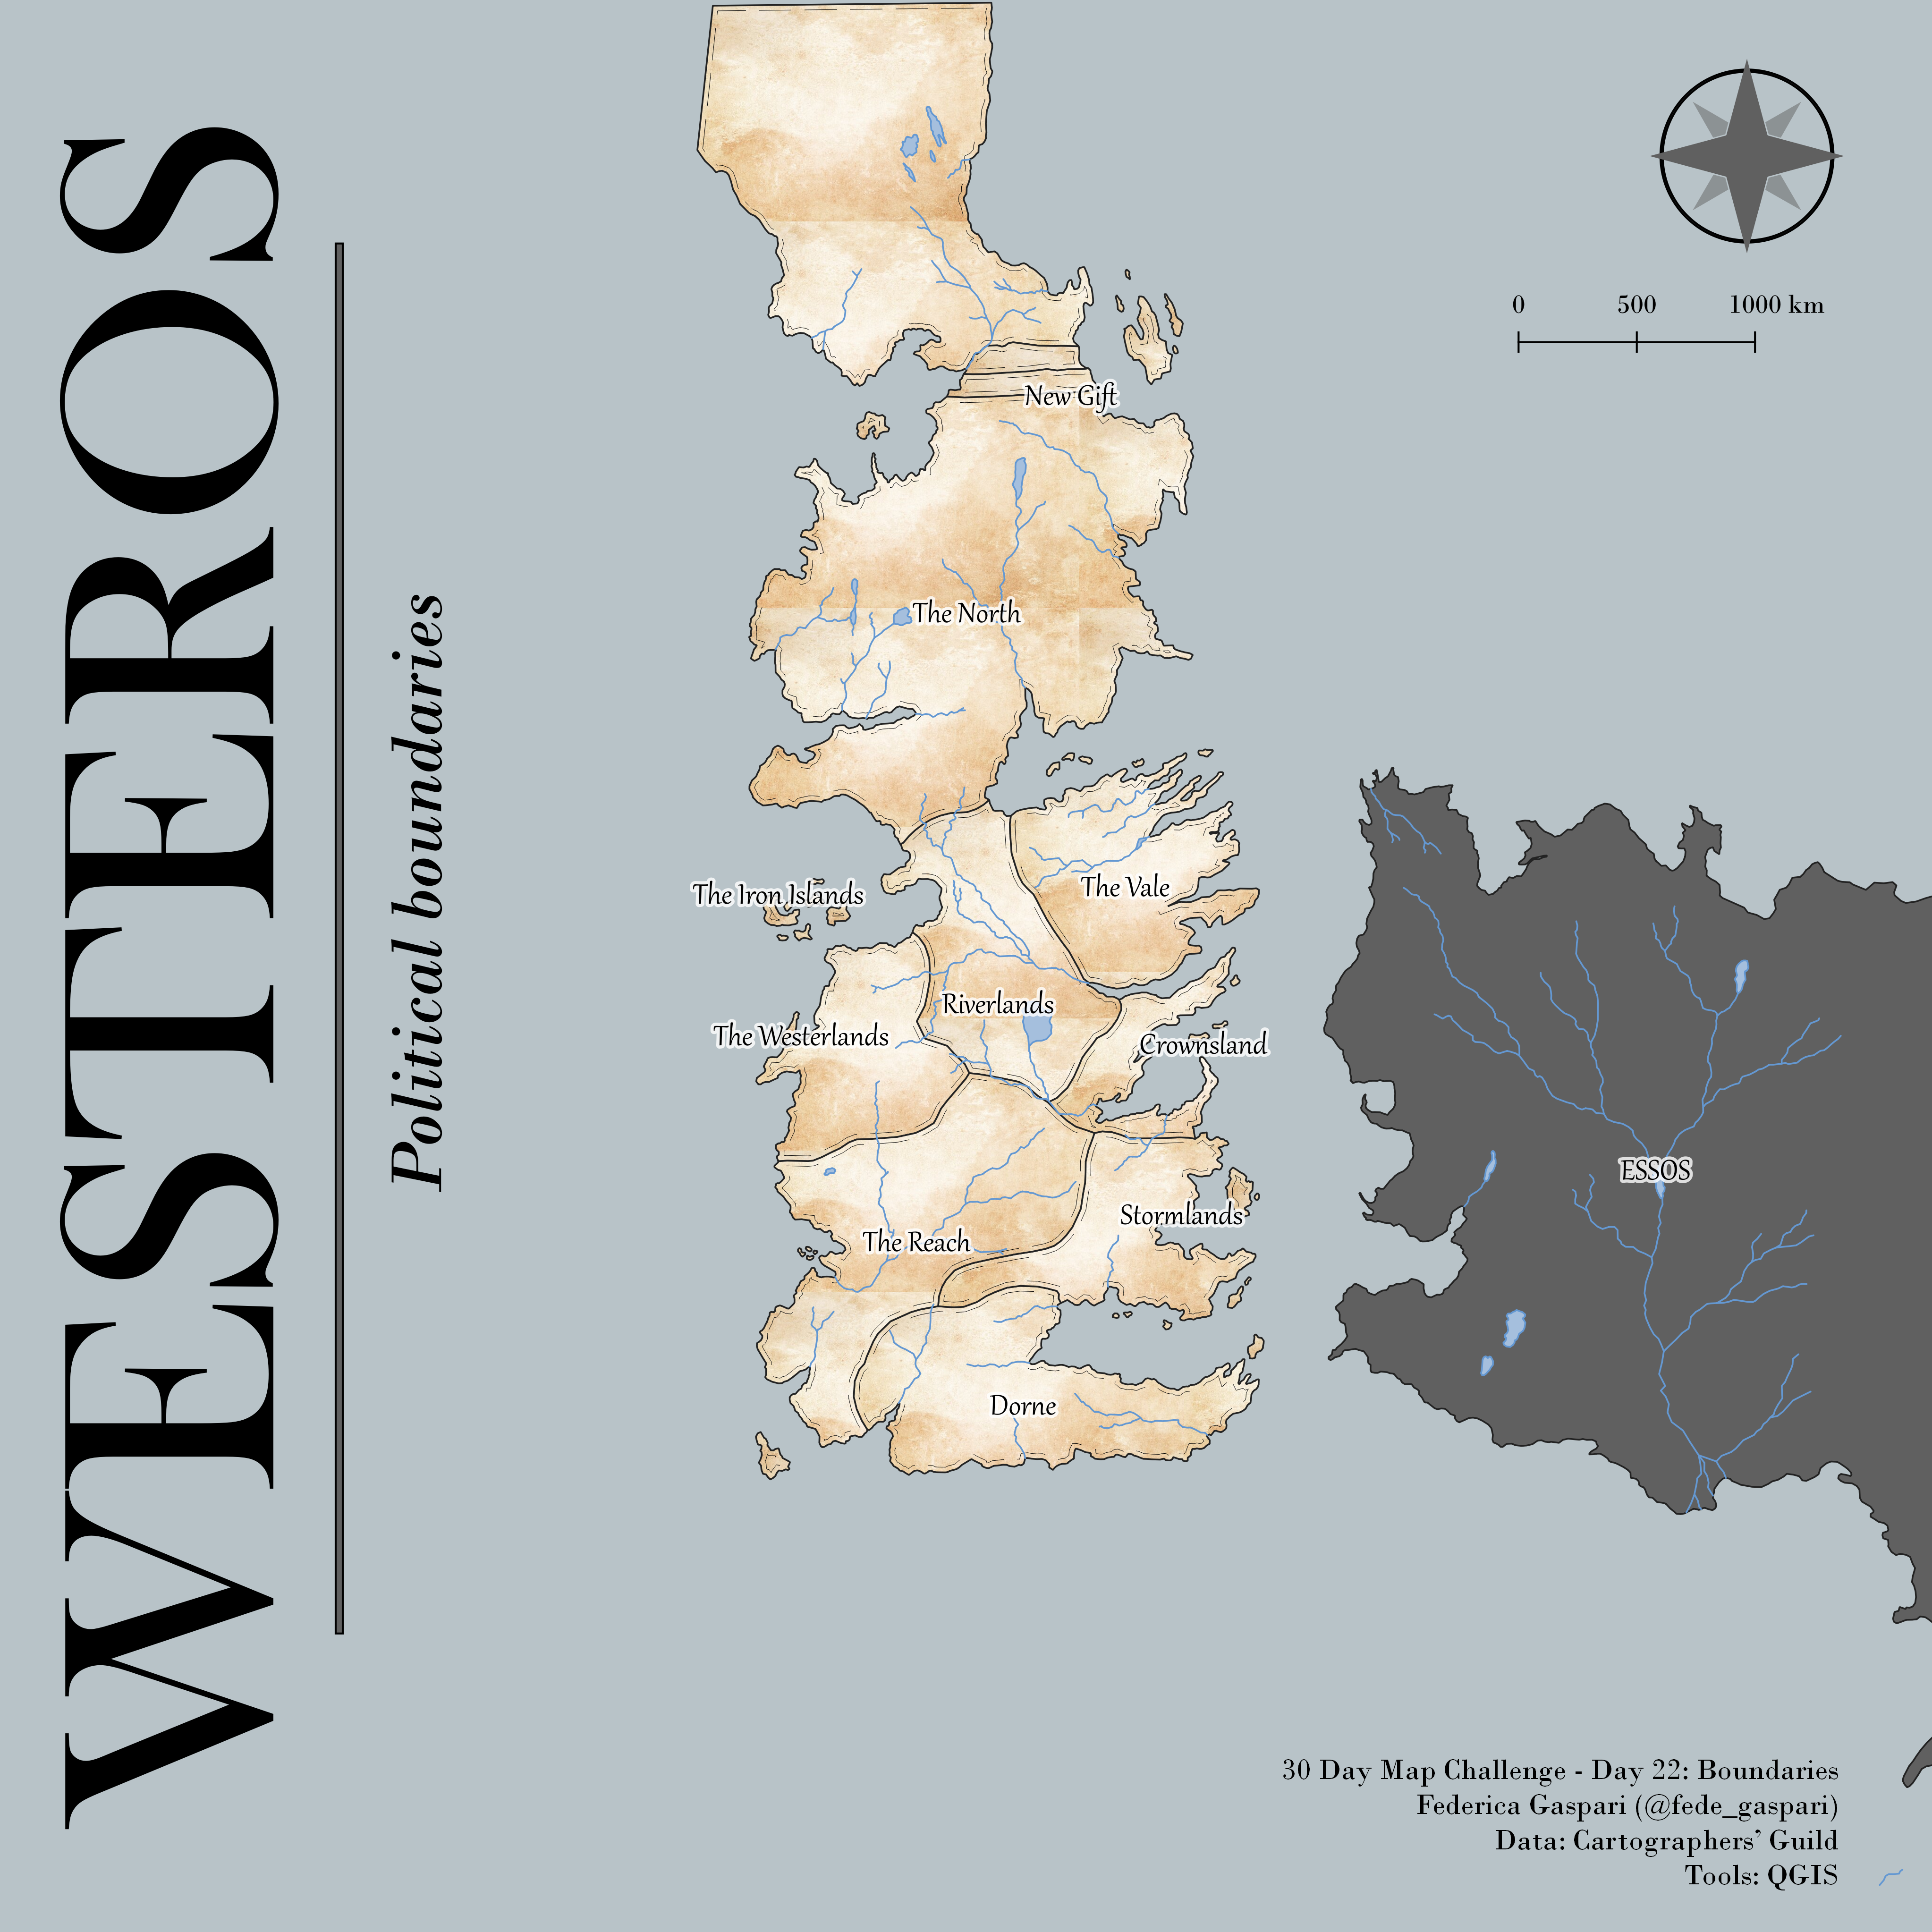
Day 22: Boundaries
Boundaries are all around us. Some of them are visible and some of them are in our heads.
QGIS map layout depicting the political boundaries of Westeros, the fictional land of Game of Thrones narrative universe. Data from Cartographers’ Guild forum.
Day 23: Data challenge 3: GHSL
The third data challenge should be created using this great dataset by EC JRC on human population.
GHSL 2015 Population of Lombardia region in Italy. Data pre-processed in QGIS using ISTAT data for the administrative boundaries. Rendered in turntable mode in Aerialod.
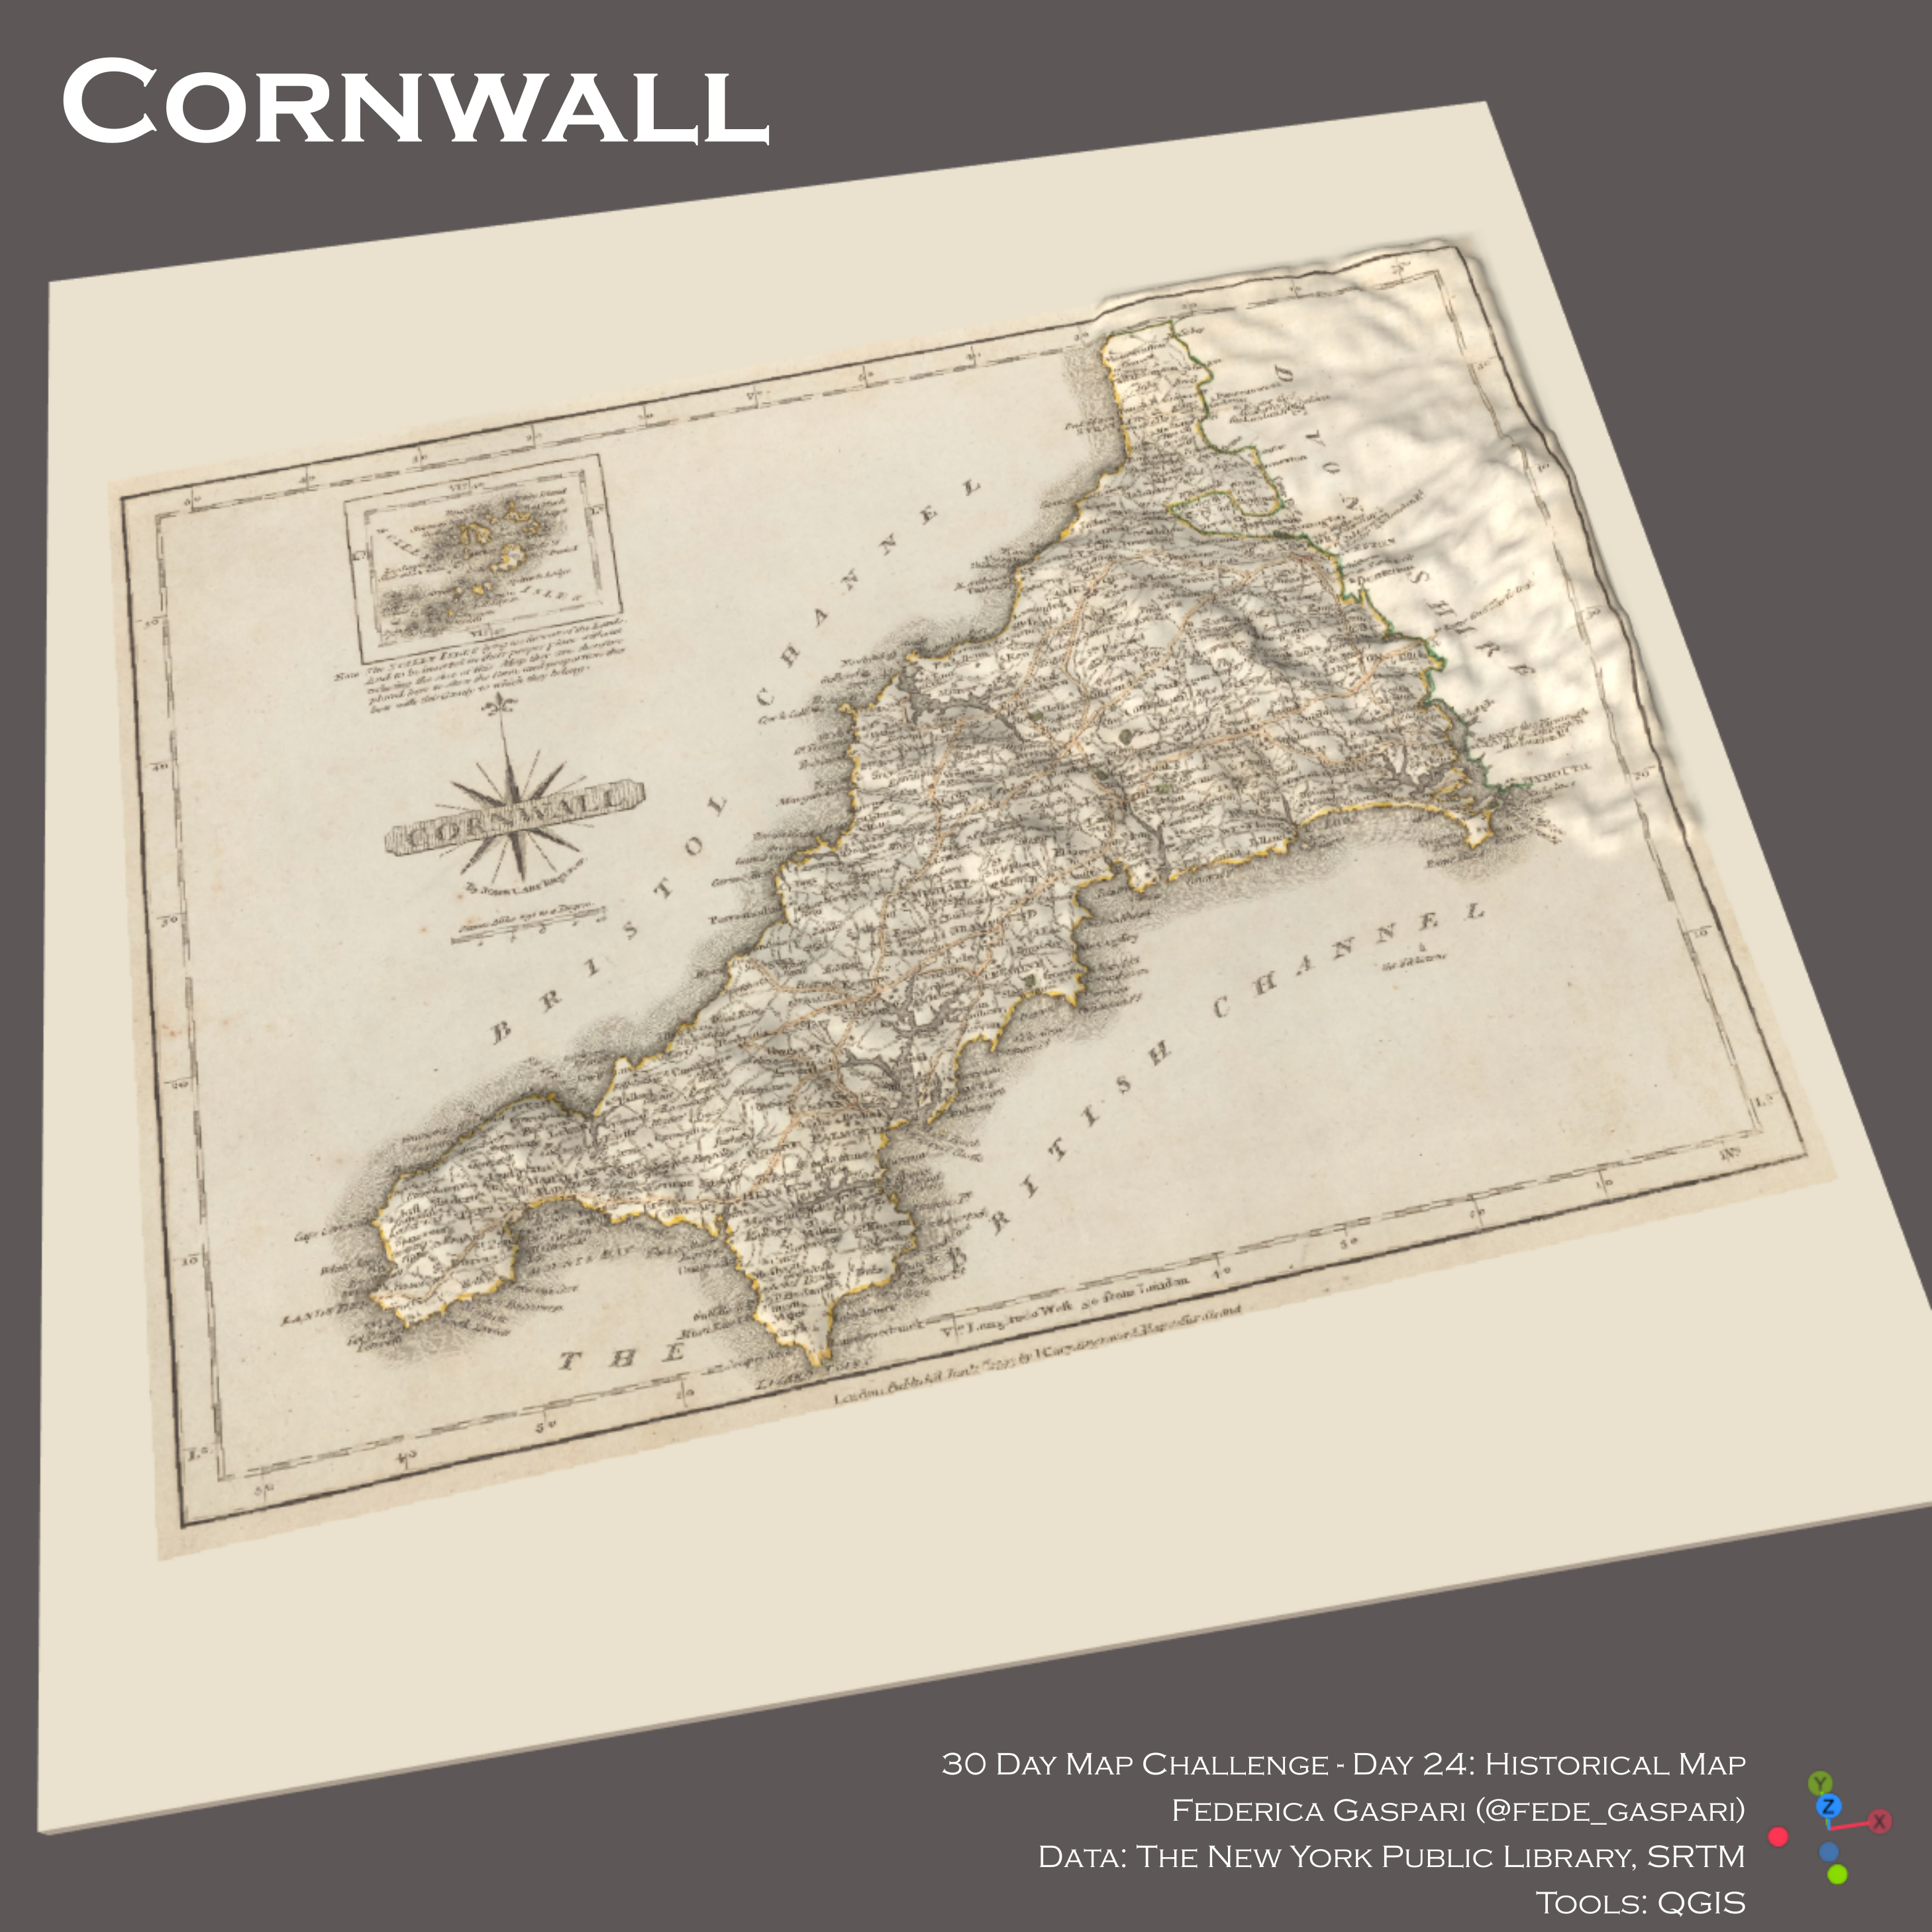
Day 24: Historical map
Historical data, historical style or something else.
3D interactive map of 1793 map of Cornwall made wity QGIS2threejs plugin. Original map data from The New York Public Library, elevation from SRTM. Interactive view here.
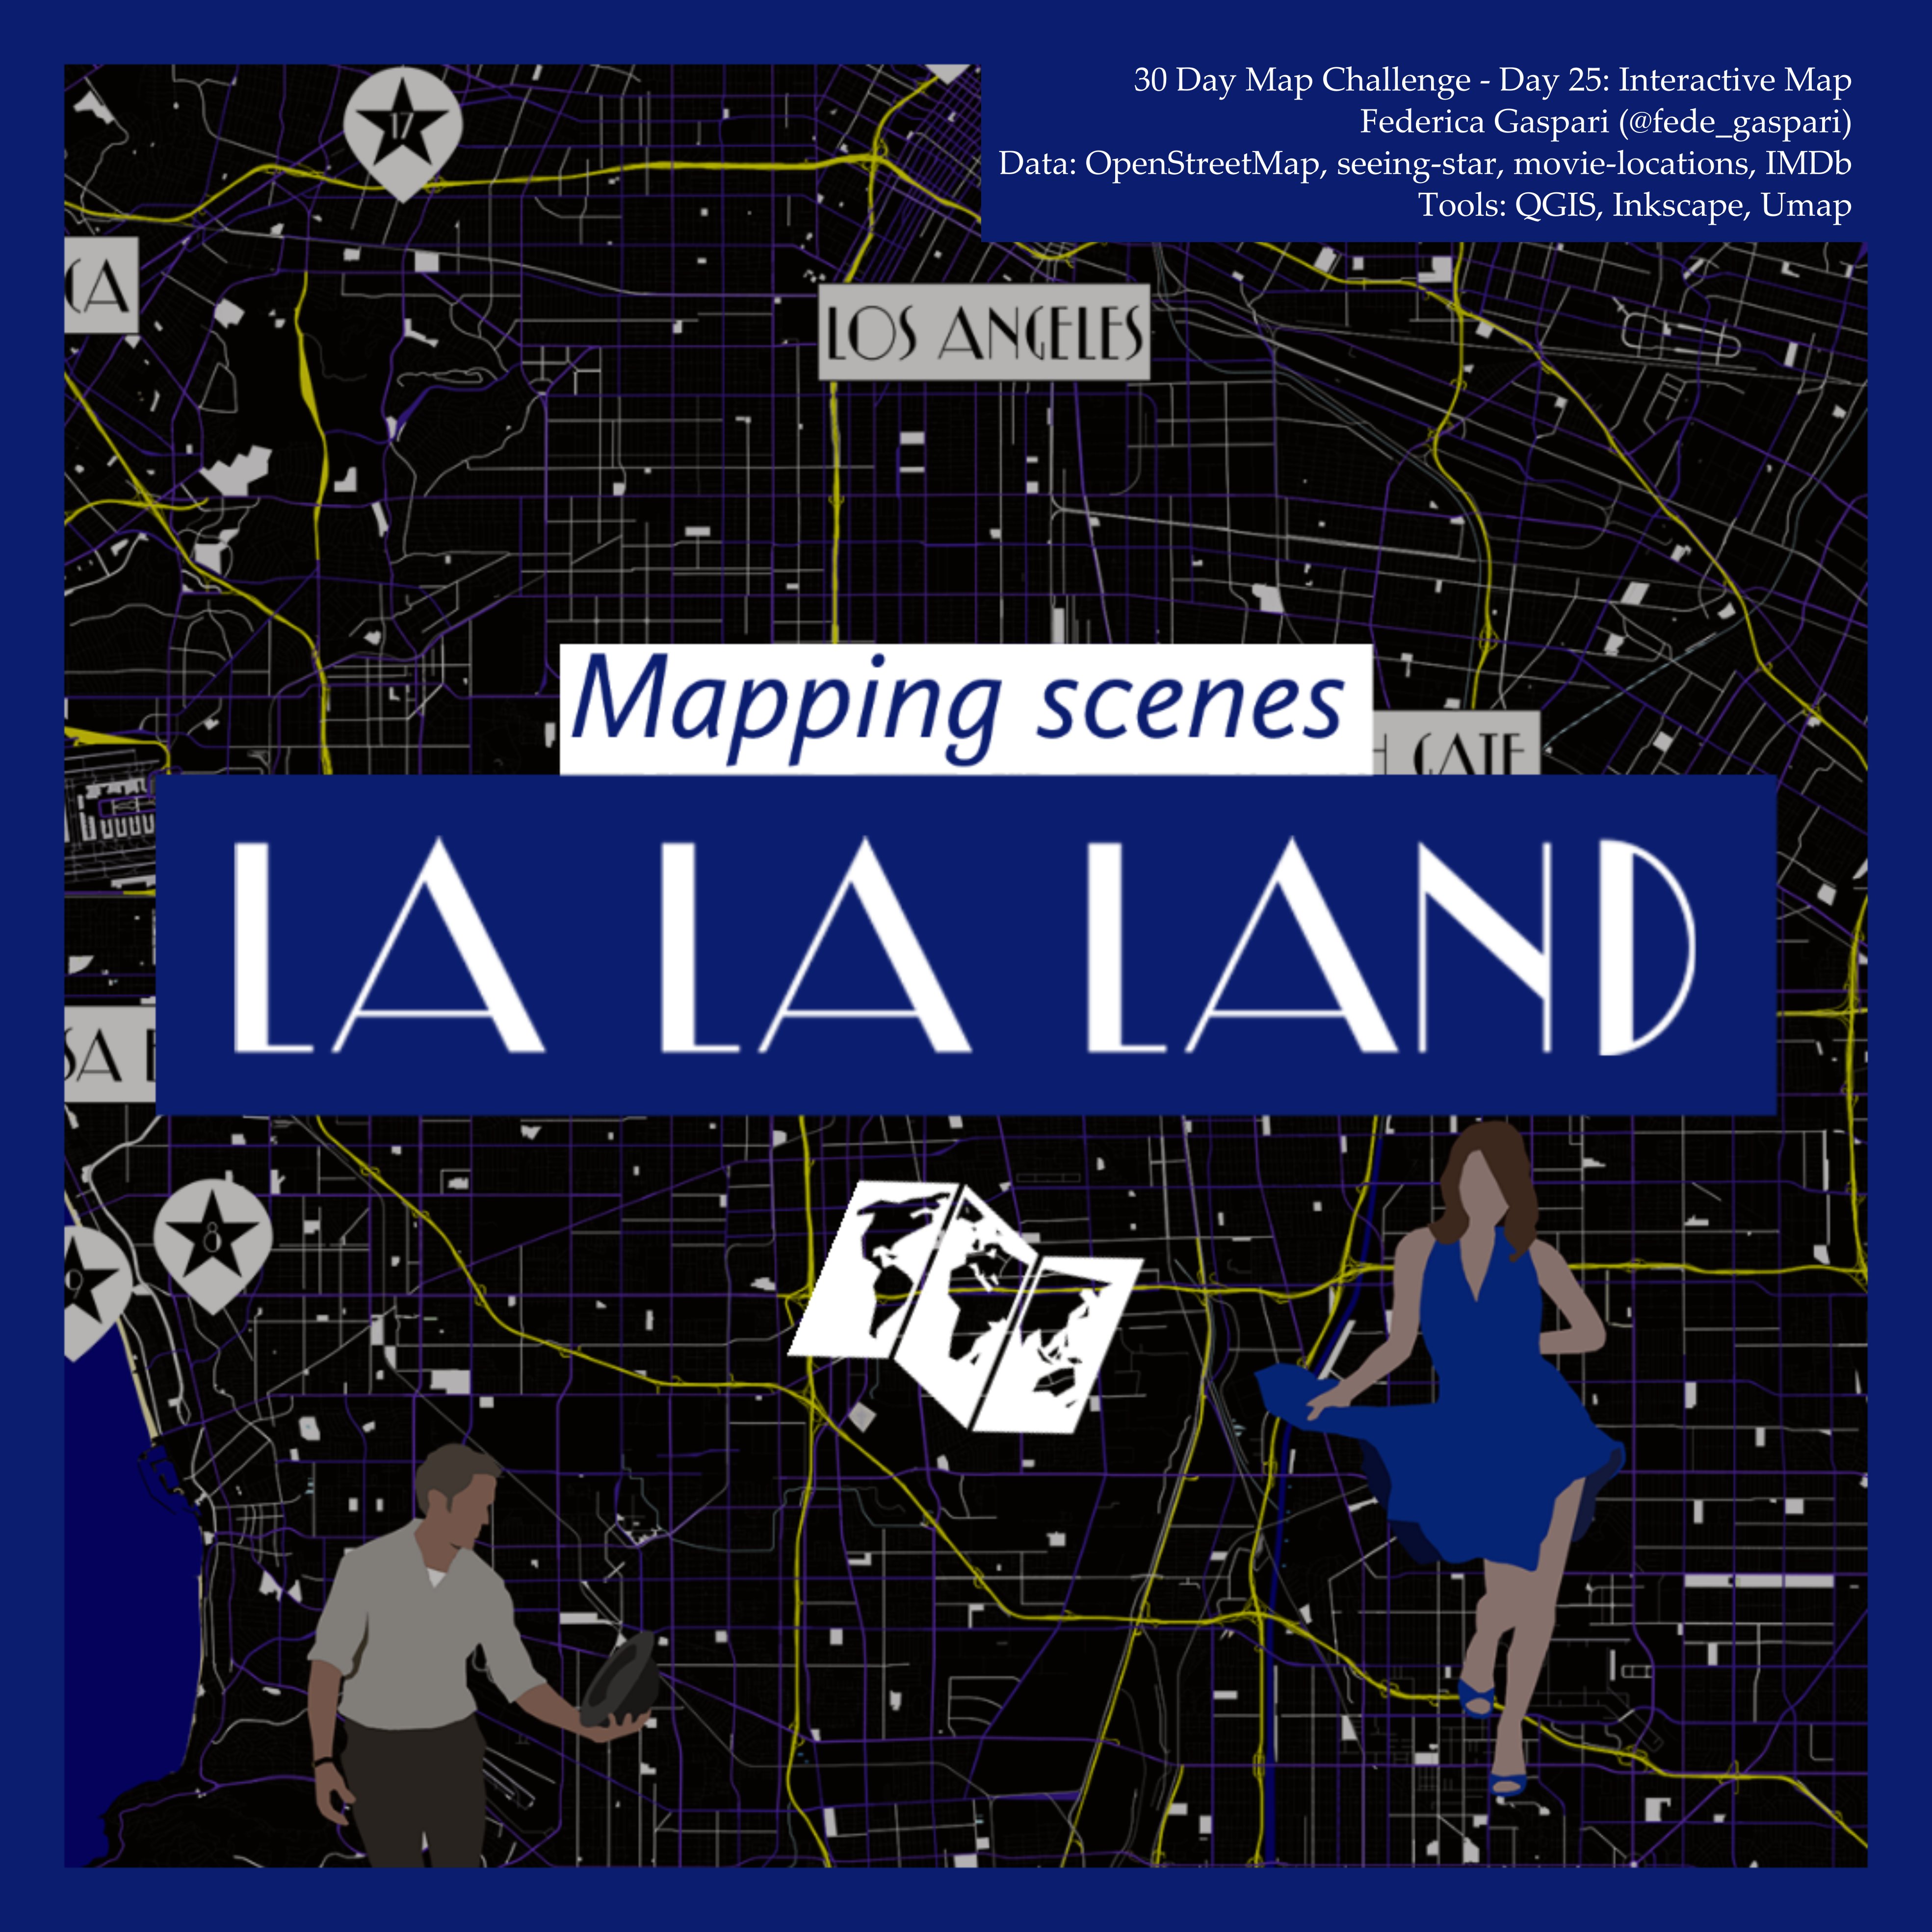
Day 25: Interactive map
What if the user wants to click, pan and explore your map?
Interactive map of La La Land movie locations originally created for IlTermopolio. Interactive version available on UMap. Data from OpenStreetMap, seeing-stars, movie-locations, IMDb processed in QGIS and Inkscape.
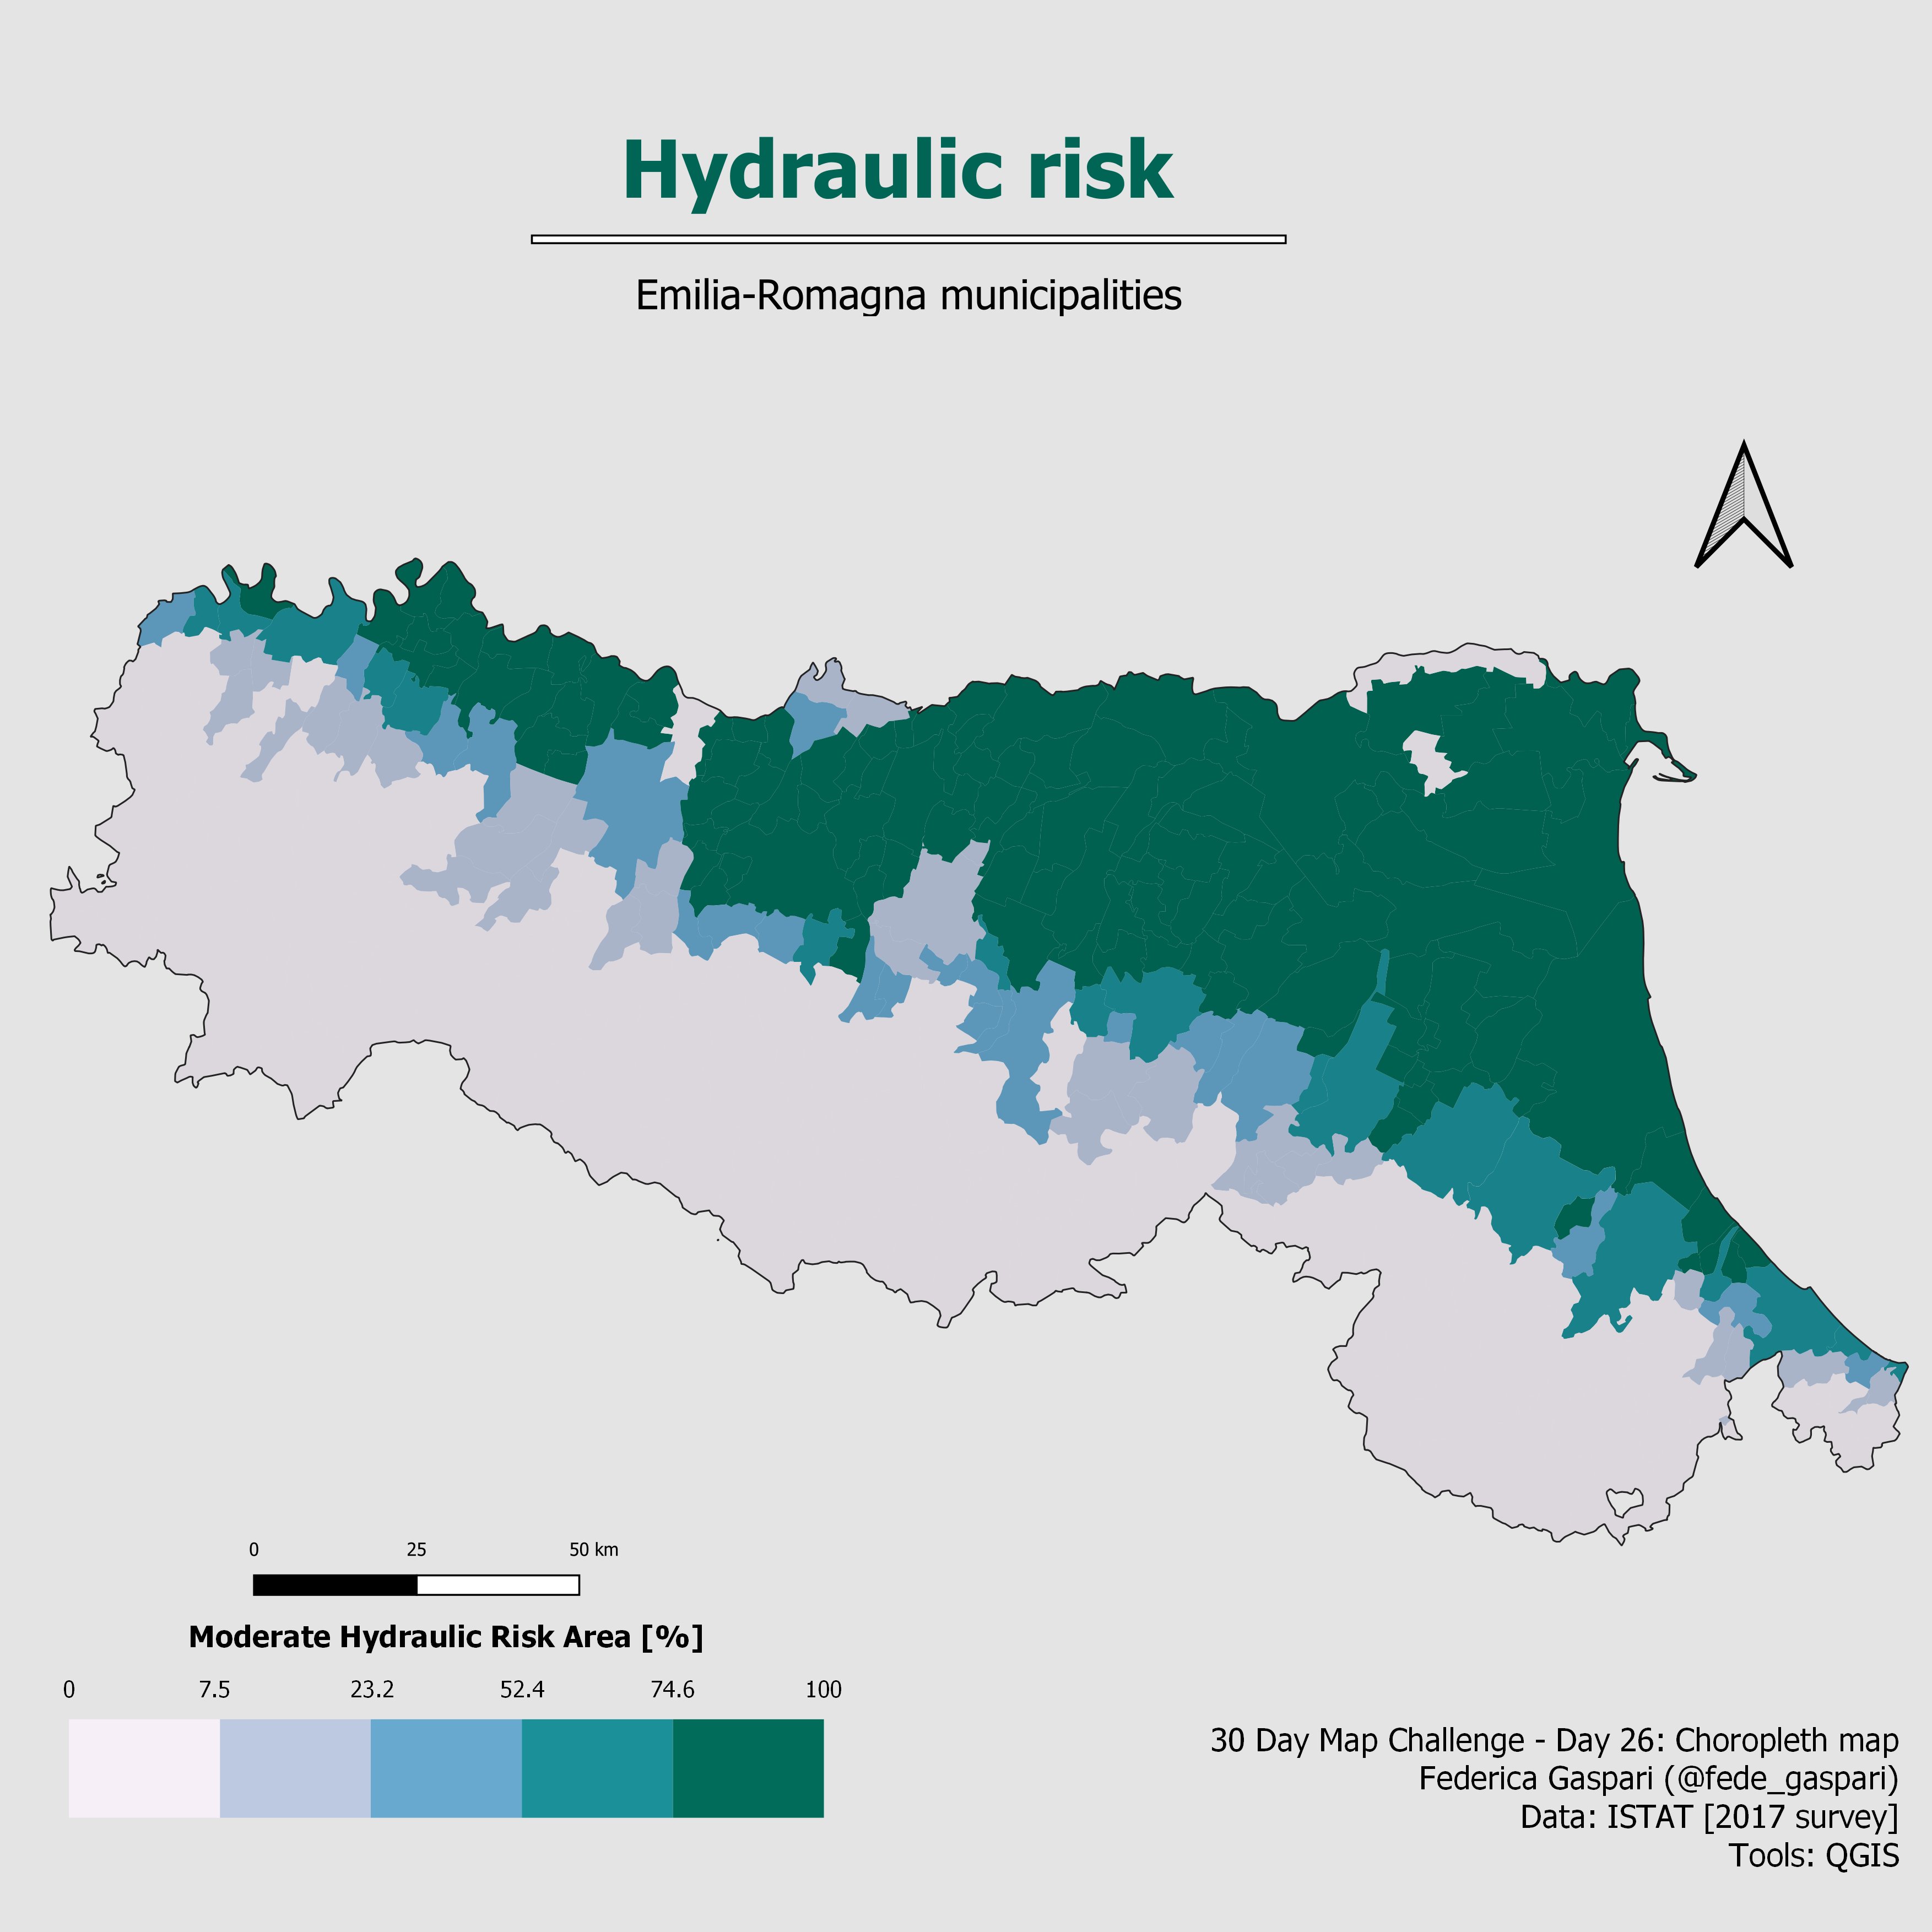
Day 26: Choropleth map
A choropleth map is a type of thematic map in which a set of pre-defined areas is colored or patterned in proportion to a statistical variable that represents an aggregate summary of a geographic characteristic within each area, such as population density or per-capita income.
Chropleth map style derived from hydraulic risk affected areas of Regione Emilia Romagna (Italy). Data from ISTAT processed in QGIS.
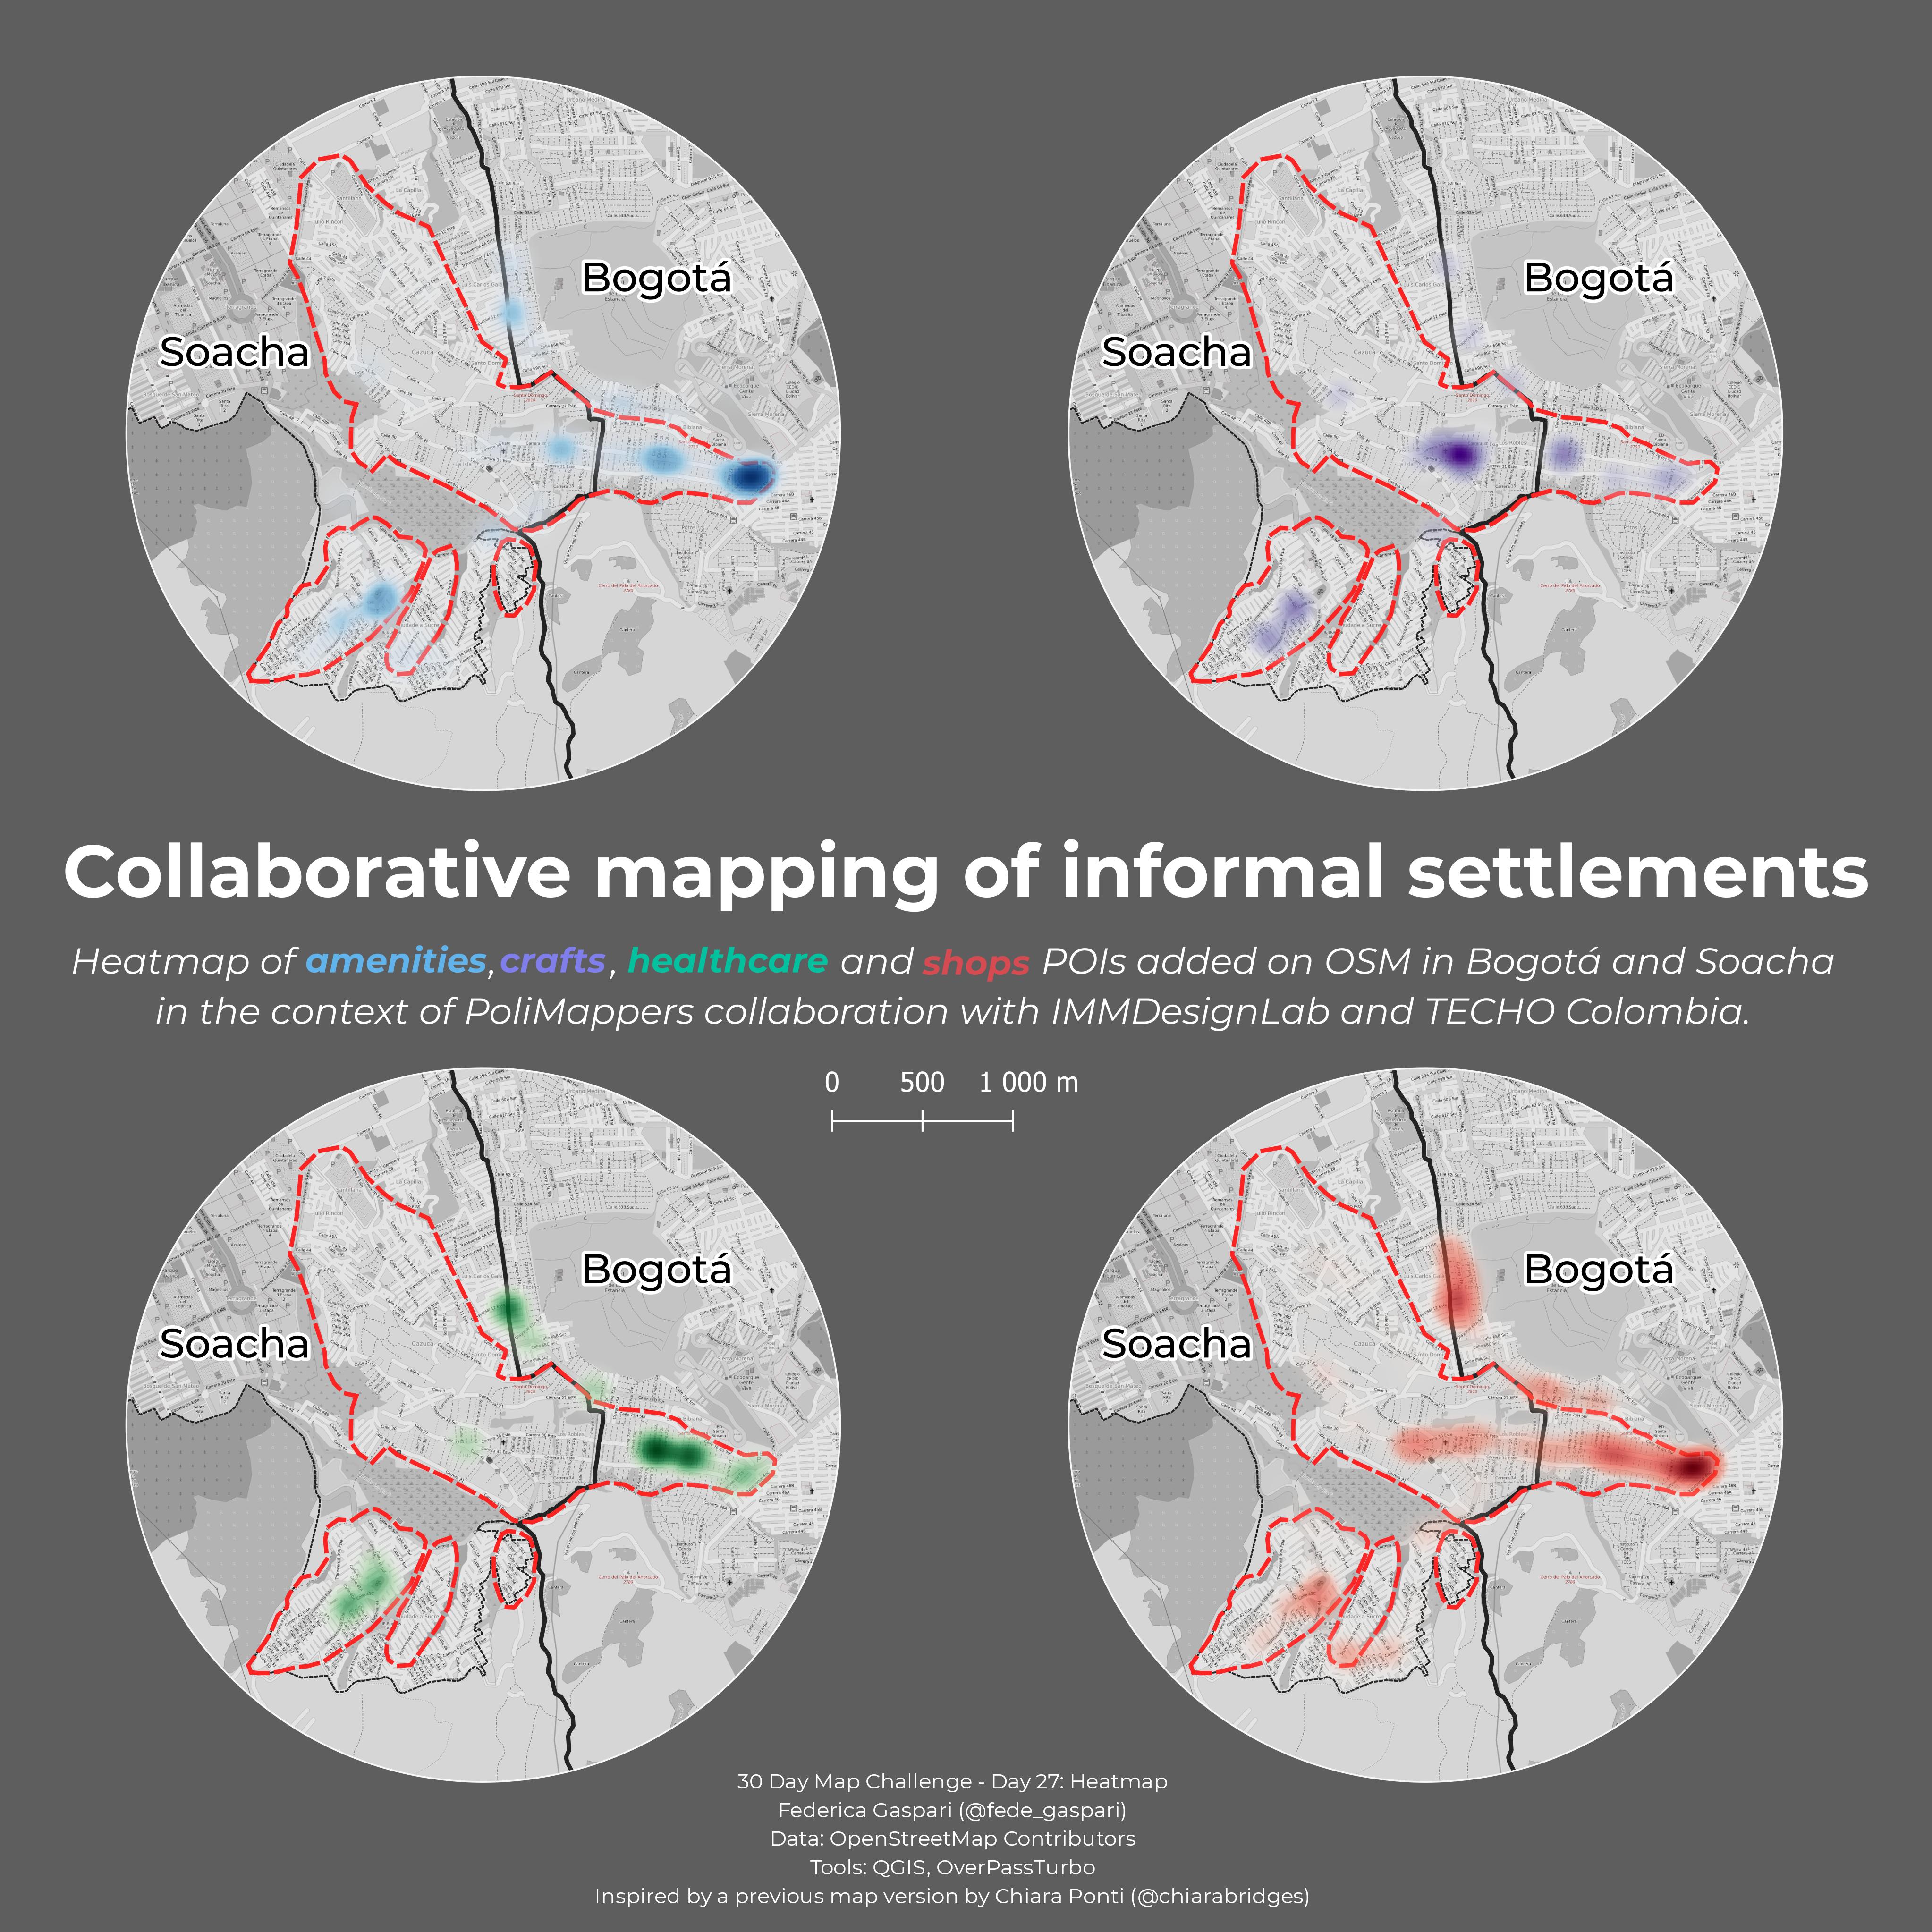
Day 27: Heatmap
A heat map (or heatmap) is a data visualization technique that shows magnitude of a phenomenon as color in two dimensions.
Heatmap of the contribution to OpenStreetMap recorded in the context of the PoliMappers collaboration with IMMDesignLab and TECHO Colombia for the collaborative mapping of informal settlements between Bogotà and Soacha.
Day 28: The Earth is not flat
The Earth isn’t flat (AFAIK), so how would you show that on a map?
Geo-animation of the tour gigs of the Formation World Tour by Beyoncé that took place in 2016. Data from Wikipedia, WikiData and Natural Earth. Tools: QGIS and GIMP.
Day 29: NULL
…

Day 30: Metamapping day
Final day! Spend the day either by 1) collecting your entries from the challenge to a common gallery, 2) writing a tutorial or a blog post on one of your maps or 3) create a map from a theme you have chosen yourself
A blogpost? A gallery? Why not both? While gathering together all the previous submissions for the challenge at this link, it has been amazing to revisit the small and big tasks of each day. Day by day, I had the opportunity to deal with different kind of data, experimenting with the most efficient data preparation workflow and discovering new and exciting data sources. The main idea was to get out of the usual comfort zone along the entire challenge, for both analysis, tools and especially final visualisation of the results. After 30 days I can tell I’m grateful to Topi Tjukanov, creator of #30DayMapChallenge, and to the entire Twitter community of the challenge for inspiring me every day with new ideas, projects and suggestions: it was extremely fun to explore Twitter and find it full of amazing and passionate map contributions over the past 4 weeks!
During the challenge, I tried as much as possible to leverage familiar and new tools, paying particular attention to open-source technologies. The good, old and beloved QGIS played a key role for the majority of the contributions but other software become gradually more and more relevant in my maps. In particular, I can tell that now I’m a big fan of Aerialod and Blender, after totally falling in love with their 3D representation potentials. And what about geo-gif? Starting playing with animation made me realise how versatile and incredibile could be a tool like QGIS Atlas!
Here’s the complete list of the tools I used for this challenge:
- QGIS
- OverPass Turbo
- Inkscape
- Mapillary Services
- Aerialod
- MATLAB
- WikiData Query Service
- Kepler.gl
- Blender
- Google Earth Engine
- GIMP
- UMap
- github
- TweetDeck
Last but not the least, I’d like to first acknowledge the support and suggestions of friends along the entire #30DayMapChallenge journey. Their help and feedback on map and rendering has been extremely valuable to every map entries. Thanks also to all the amazing Twitter social-mappers with each I had the opportunity to interact during the challenge: the human component of this event is without any doubts the most intriguing and challenging, with exchange of ideas and perspectives on different topics.
…and now, what’s next? Well, the ideas are even more than the ones I had at the beginning of this journey. For sure, I’d like to experiment more with coding, gaining some hands-on experience with spatial analysis with Python and/or R. The great tutorials and blog posts shared by the community will be important starting point for this new learning adventures that (maybe) will results in some dedicated contributions for the next #30DayMapChallenge.
So, probably that’s not all: it’s very difficult to summarize in few words all the feelings and experiences of these past 30 days. However, another Challenge is over and I can’t wait for new exciting ones on both personal and technical levels. Have a mappy December!